| | Audit Committee:The Audit Committee has oversight responsibility for Enterprise Risk Management (ERM), and specifically, oversight of major financial risk exposures, including litigation and compliance risk and the steps management has taken to monitor and mitigate such exposures. The Committee also receives regular updates from management, including the General Counsel, on litigation risk. | | Executive Compensation & Development Committee:The Executive Compensation & Development Committee has oversight responsibility for the management of risk relating to the Company’s annual and long-term compensation program. The Committee ensuresaims to ensure that the Company’s annual and long-term incentive plans do not incentivize or encourage excessive or unnecessary risk-taking.
| | | | | | Technology Committee: The Technology Committee has oversight responsibility of risks related the Company’s management and development of technology, primarily those relevant to customer facing products and services, and internal IT systems. The Committee receives regular updates from management on risks in these areas, including data and enterprise security. | | | | | | How Do We Address Risk in Our Compensation Program? | | | | | | The Company’s compensation program is designed to attract, retain, motivate and reward talented executives and colleagues whose efforts will enable the Company to produce superior results and maximize return to shareholders. Our pay-for-performance philosophy focuses colleagues’ efforts on delivering short-term and long-term financial success for our shareholders without encouraging excessive risk taking. The Executive Compensation & Development Committee, (“Compensation Committee”), which consists entirely of independent Board members, oversees the executive compensation program for the named executive officers, as well as other senior officers of the Company. |
| | The following is a description of both Compensation Committee and management processes related to the compensation risk assessment process, as well as a description of the Company’s compensation risk mitigation techniques. | | | | | | The Compensation Committee reviews and approves the annual and long-term plan performance measures and goals annually. This includes setting appropriate threshold and outstanding performance levels for each performance metric. As a part of this process, the Compensation Committee focuses on what behavior it is attempting to incentivize and the potential associated risks. The Compensation Committee periodically receives financial information from the Chief Financial Officer, and information on accounting matters that may have an impact on the performance goals, including any material changes in accounting methodology and information about extraordinary/special items excluded in the evaluation of performance, as permitted by the 2009 and 2014 Executive Annual Incentive Plan and the 2014 Key Employee Stock Plan (i.e. the shareholder plans), so that the Compensation Committee members may understand how the exercise of management judgment in accounting and financial decisions affects plan payouts. Members of the Compensation Committee approve the final incentive compensation awards after reviewing executive, corporate and business performance, and may utilize negative discretion if they believe the level of compensation is not commensurate with performance. |
| | The following compensation policies and practices serve to reduce the likelihood of excessive risk taking: | | | | | | ● An appropriate compensation mix that is designed to balance the emphasis on short-termshort- term and long-term performance. | | | | | | ● The majority of incentive compensation for top level executives is associated with the long term performance of the Company. This discourages short-term risk taking. | | | | | | ● The mix offocus on performance share units stock options and restricted share units used in our executive long-term plans ensureplan ensures a correlation between executive rewards and shareholder rewards.Conservative vesting provisions (4 to 5 years) for all equity awards granted under our long-term incentive plans.
return. | | | | | | ● Financial performance measures used for incentive plans covering colleagues at all levels of the Company include a mix of financial metrics that are in line with operating and strategic plans. | | | | | | ● Financial performance measures used for our annual incentive plan are different than the performance measures used in our long-term incentive plan. | | | | | | ● A significant portion of annual and long-term incentive payments are based on Company and business profitability, ensuring a correlation between pay and performance. | | | | | | ● Financial targets are appropriately set, and if not achieved, result in a large percentage loss of compensation. | | ● Executive and broad-based incentive plans cap the maximum award payable to any individual. Annual and long-term incentive plans have a maximum payout of 1.5 times the target amount. | | | | | | ● Recoupment or “clawback” provisions for top executives and key finance executives in the event that an executive’s conduct leads to a restatement of the Company’s financial results. | | | | | | ● Stock ownership guidelines and stock retention requirements for our named executive officers, other senior officers and directors discourage excessive risk taking. | | | | | | We are confident that our compensation program rewards for performance, is aligned with the interests of our shareholders and does not involve risks that are reasonably likely to have a material adverse effect on the company.Company. A more detailed discussion of the Company’s executive compensation program can be found in the Compensation Discussion and Analysis beginning on page 23.26. | | | | | | Transactions with Related Persons | | | | | | We are required to disclose material transactions with the Company in which “related persons” have a direct or indirect material interest. Related persons include any Director, nominee for Director, executive officer of the Company, beneficial owner of more than 5% of any class of | |
| | the Company’s voting securities, and any immediate family members of such persons. The term “transaction” is broadly defined under Securities and Exchange CommissionSEC rules to include any financial transaction, arrangement or relationship, including any indebtedness transaction or guarantee of indebtedness.indebtedness or any series of similar transactions, arrangements or relationships. | | | | | | The Company’s Board of Directors has adopted a written policy that requires the Audit CommitteeChief Executive Officer to review and approve any related party transactions. Management is expectedtransactions with respect to provideexecutive officers, and the Audit Committee with specific informationto review and approve related person transactions with respect to any such transaction expected todirectors, director nominees, and the Chief Executive Officer. Such transactions will only be enteredapproved after taking into or continued during the current fiscal year. After reviewing this information, the Audit Committee will approve such transactions only if the following two conditions are met: (1)consideration whether the transaction must be inis fair and reasonable and is consistent with the best interests of the Company. Factors to be taken into account in making the determination may include the business purpose of the transaction, whether the transaction is entered into on an arms-length basis on terms fair to the Company, and its shareholders; and (2)whether the transaction must be entered into bywould violate the Company on terms that are comparable to those that would be obtained in an arm’s length transaction with an unrelated third party.provisions of the Company’s Business Conduct and Ethics Policy. | | | | | | Based on information available to us and provided to us by our Directors and executive officers, we do not believe that there were any such material transactions in effect during Fiscal 2015,2017, or that any such material transactions are proposed to be entered into during fiscal 2016.Fiscal 2018. |
| | Corporate Governance Principles | | | | | | To promote the best corporate governance practices, the Company adheres to the Corporate Governance Principles set forth below, many of which have been in effect for more than a decade. The Board of Directors and management believe that these Principles, which are consistent with the requirements of the Securities and Exchange CommissionSEC and the New York Stock Exchange,NYSE, are in the best interests of the Company, its shareholders and other stakeholders, including employees, authors, customers and suppliers. The Board is responsible for ensuring that the Company has a management team capable of representing these interests and of achieving superior business performance. | | | | | | Pursuant to the New York Stock Exchange’s Corporate Governance regulations,NYSE rules, the Company is considered a “controlled company,” defined as a company where more than 50 percent of the voting power is held by an individual, a group, or another company. As such, the Company would be exempt from certain corporate governance standards. However, the Board believes it is in the best interest of the Company and its shareholders to abide by all of the regulations,NYSE listing rules, except for the requirement that the Governance Committee be comprised of independent directors only. The Board has chosen to take an exemption to this requirement because it believes that a Wiley family member’s participation on this Committee will result in a collaborative process to promote the highest standards in the recruitment of new directors and in governance generally. | | I. Primary Duties | | | | | | The Board, which is elected annually by the shareholders, exercises oversight and has final authority and responsibility with respect to the Company’s affairs, except with respect to those matters reserved to shareholders. All major decisions are considered by the Board as a whole. | | | | | | The Board electsappoints the Chief Executive Officer (“CEO”) and other corporate officers, acts as an advisor to and resource for management, and monitors management’s performance. | | | | | | The Board plans for the succession of the CEO. The ExecutiveDecisions regarding the CEO’s compensation are determined by the Compensation and Development Committee, annually evaluatesbased on an evaluation of the CEO’s performance approvesby the Executive Committee. The Compensation Committee, based on an evaluation of the CEO’s performance by the Executive Committee, determines the CEO’s compensation, and informsdiscusses its recommendation with the Board of its decisions.in executive session. The Board also oversees the succession process for certain other management positions, and the CEO reviews with the Board annually his assessment of key management incumbents and their professional growth and development plans. The Board also: | a) | | | | | | a) reviews the Company’s business and strategic plans and actual operating performance; |
| b) | | | | | | b) reviews and approves the Company’s financial objectives, investment plans and programs; and |
| c) | | | | | | c) provides oversight of internal and external audit processes and financial reporting. |
| | II. Director Independence | | | | | | The Board has long held that it is in the best interests of the Company for the Board to consist of a substantial majority of independent Directors. The Board annually determines that a Director is independent if he or she has no material relationship, either directly or indirectly, withpursuant to its Company’s independence guidelines set forth in the Company, defined as follows: | a) | The Director is not and has not been employed in an executive capacity by the Company or its subsidiaries within the three years immediately prior to the annual meeting at which the nominees of the Board will be voted upon. |
| b) | The Director is not a significant advisor or consultant to the Company (including its subsidiaries); does not have direct, sole responsibility for business between the Company and a material supplier or customer; and does not have a significant personal services contract with the Company. |
| c) | The Director is not an executive officer, an employee, and does not have an immediate family member who is an executive officer or employee, of an organization that makes payments to, or receives payments from, the Company in an amount which, in any single fiscal year, exceeds 2% of such other organization’s consolidated gross revenues. |
| d) | The Director is not, and has not been within the past three years, employed by or affiliated with a firm that provided independent audit services to the Company; the Director is not, and does not have an immediate family member who is a current partner of the firm that is the Company’s external auditor; and the Director or an immediate family member was not within the past three years a partner or employee of the Company’s external audit firm and personally worked on the Company’s audit within that time. |
| e) | The Director is not, and has not been in the past three years, part of an interlocking directorship involving compensation committees; and |
| f) | The Director is not a member of the immediate family of Peter Booth Wiley, Bradford Wiley II, Deborah E. Wiley and Jesse Wiley, or management, as listed in the Company’s proxy statement. |
Company’s Corporate Governance Principles. When determining the independence of a Director, the ownership of, or beneficial interest in, a significant amount of stock, by itself, is not considered a factor. | | | III. Composition of the Board | | | | | | Under the Company’s By-Laws, the Board has the authority to determine the appropriate number of directors to be elected so as to enable it to function effectively and efficiently. The Governance Committee makes recommendations to the Board concerning the appropriate size of the Board, as well as selection criteria for candidates. Each candidate is selected based on background, experience, expertise, and other relevant criteria, including other public and private company boards on which the candidate serves. In addition to the individual candidate’s background, experience and expertise, the manner in which each board member’s qualities complement those of others and contributes to the functioning of the Board as a whole are also taken into account. The Governance Committee nominates a candidate, and the Board votes on his or her candidacy. The shareholders vote annually for the entire slate of Directors. | | | | | | Any nominee Director who receives a greater number of “withheld” votes from his or her election than “for” votes shall tender his or her resignation for consideration by the Governance Committee. The Governance Committee shall recommend to the Board the action to be taken with respect to such resignation. | | | | | | IV. Director Eligibility | | | | | | Directors shall limit the number of other board memberships in order to insureensure adequate attention to Company business. Because of the time commitment associated with Board service, unless otherwise approved by the Board, (i) Directors are expected to limit the number of public-company boards on which they serve to no more than five, and (ii) Directors who are CEO’s of other public companies are expected to limit the number of public-company boards on which they serve to no more than three. Prior to joining the board of another organization, including a public or private company, as well as a not-for profit organization, directors are required to adviseseek the Chairmanapproval of the Board, the Chair of the Governance Committee and the President and Chief Executive Officer so that a review can be performed to ensure that there are no conflicts of interest or other issues. While the Board of Directors does not believe it appropriate to establish an arbitrary limit on the number of outside boards upon which a Director may serve, theThe Board (based on the review and recommendation of the Governance Committee), has the responsibilityauthority to evaluate each situation and approve membership.situation. |
| | Whenever there is a substantial change in the Director’s principal occupation, a Director shall immediately inform the Chair of the Governance Committee of any potential conflict of interest and shall tender his or her resignation and shall immediately inform the Board of any potential conflict of interest.upon written request. The Governance Committee will recommend to the Board the action, if any, to be taken with respect to the resignation or the potential conflict of interest. Directors are also required to provide prompt notice to the Chair of the Governance Committee of any changes to his or her board memberships. | | | | | | The Board has established a retirement age of 70 for its Directors. The Board may, in its discretion, nominate for election a person who has attained age 70 or over if it believes that under the circumstances it is in the Company’s best interests. | | | | | | V. Board and Management Communication | | | | | | The Board has access to all members of management and external advisors. As appropriate, the Board may retain independent advisors. |
| | The CEO shall establish and maintain effective communications with the Company’s shareholder groups. The Board schedules regular executive sessions at the end of each meeting. Non-management directors meet at regularly scheduled sessions without management. The Chairman of the Board presides at these sessions. In addition, the independent directors meet at least once each year in an executive session presided over by the Chairman of the Governance Committee or the Executive Committee. | | | | | | Employees and other interested parties may contact the non-management directors via email at: non-managementdirectors@wiley.com, or by mail addressed to Non-Management Directors, John Wiley & Sons, Inc., Mail Stop 9-12, 111 River Street, Hoboken, NJ 07030-5774. | | | | | | The Company has also established a Whistleblower hotline for the reporting of known or suspicious activities that could adversely affect the Company by shareholders, employees and customers, and regularly reports any activity to the Audit Committee. | | | | | | VI. Board Orientation and Evaluation | | | | | | The Board annually conducts a self-evaluation to determine whether the Board as a whole and its individual members, including the Chairman, are performing effectively. | | | | | | The Board sponsors an orientation process for new Directors, which includes background materials on governance, law, board principles, financial and business history and meetings with members of management. The Board also encourages all of its Directors to take advantage of educational programs to improve their effectiveness. | | | | | | VII. Director Compensation | | | | | | The Governance Committee periodically reviews and recommends to the Board its members’ annual retainer, which is composed of cash and stock grants for all non-employee Directors. In determining the appropriate amount and form of director compensation, the Board regularly evaluates current trends and compensation surveys, as well as the amount of time devoted to Board and committee meetings. As a long-standing Board principle, non-employee Directors typically receive no compensation from the Company other than for their service as Board members and reimbursement for expenses incurred in connection with attendance at meetings. |
| | Share ownership by each Director is encouraged. To this end, each Director is expected to own shares of Wiley common stock valued at not less than five times that Director’s annual cash compensation to which the Director is entitled for Board service. | | | | | | VIII. Board Practices and Procedures | | | | | | The Chairman of the Board and the CEO jointly set the agenda for each Board meeting. Agenda items that fall within the scope and responsibilities of Board committees are reviewed with the chairs of the committees. Any Board member may request that an item be added to the agenda. | | | | | | Board materials are provided to Board members sufficiently in advance of meetings to allow Directors to prepare for discussion at the meeting. | | | | | | Various managers regularly attend portions of Board and committee meetings in order to participate in and contribute to relevant discussions. |
| | Beneficial Ownership of Directors and Management | | | | | | The table below shows the number of shares of the Company’s Class A and Class B Stock beneficially owned by the current directors, and the executive officers named in the Summary Compensation Table on page 3940 and all directors and executive officers of the Company as a group as of August 4, 2015.2017. The percent of total voting power reflected below represents the voting power on all matters other than the election of directors, as described on page 3. |
| | | SHARES BENEFICIALLY OWNED BY OFFICERS AND DIRECTORS(1) | | | | | | | | | | | | | | | | | | | | | | | | Insider Name | | Title
of Class | | Amount
and
Nature of
Beneficial
Ownership | Additional
Shares
Beneficially
Owned(2) | | Total
Shares
Beneficially
Owned | | Percent
of Class | | Percentage
of Total
Voting
Power(3) | | | Shares
and Share
Equivalents
Under
Deferred
Plan(4) | | | | | Mark Allin | | A | | 22,556 | 117,378 | | 139,934 | | * | | * | | | — | | | | | | | B | | — | — | | — | | — | | — | | | — | | | | | Mari J. Baker | | A | | — | — | | — | | — | | — | | | 10,603 | | | | | | | B | | — | — | | — | | — | | — | | | — | | | | | George Bell | | A | | — | — | | — | | — | | — | | | 5,954 | | | | | | | B | | — | — | | — | | — | | — | | | — | | | | | David C. Dobson | | A | | 940 | — | | 940 | | — | | * | | | — | | | | | | | B | | — | — | | — | | — | | — | | | — | | | | | Matthew S. Kissner | | A | | — | — | | — | | — | | — | | | 30,743 | | | | | | | B | | — | — | | — | | — | | — | | | — | | | | | John A. Kritzmacher | | A | | 14,611 | 40,830 | | 55,441 | | * | | * | | | — | | | | | | | B | | — | — | | — | | — | | — | | | — | | | | | Laurie Leshin | | A | | — | — | | — | | — | | — | | | 3,753 | | | | | | | B | | — | — | | — | | — | | — | | | — | | | | | Raymond McDaniel | | A | | 500 | — | | 500 | | * | | * | | | 26,231 | | | | | | | B | | — | — | | — | | — | | — | | | — | | | | | William Pence | | A | | 2,727 | — | | 2,727 | | * | | * | | | — | | | | | | | B | | — | — | | — | | — | | — | | | — | | | | | William J. Pesce(5) | | A | | 66,965 | — | | 66,965 | | * | | * | | | — | | | | | | | B | | — | — | | — | | — | | — | | | — | | | | | William B. Plummer | | A | | — | — | | — | | — | | — | | | 44,218 | | | | | | | B | | — | — | | — | | — | | — | | | — | | | | | Kalpana Raina | | A | | — | — | | — | | — | | — | | | 14,050 | | | | | | | B | | — | — | | — | | — | | — | | | — | | | | | Gary M. Rinck | | A | | 48,982 | 147,270 | | 196,252 | | * | | * | | | — | | | | | | | B | | — | — | | — | | — | | — | | | — | | | | | John W. Semel | | A | | — | 4,475 | | 4,475 | | * | | * | | | — | | | | | | | B | | — | — | | — | | — | | — | | | — | | | | | Jeffrey Sugerman(6) | | A | | 100 | 2,610 | | 2,710 | | * | | * | | | — | | | | | | | B | | — | — | | — | | — | | — | | | — | | | | | Jesse Caleb Wiley | | A | | — | — | | — | | * | | * | | | — | | | | | | | B | | 24,565 | — | | 24,565 | | * | | * | | | — | | | | | | | | | | | | | | | | | | | | | | | | | | | | | | | | | | | | | | | | | | | All directors and | | A | | 169,330 | 371,513 | | 540,843 | | 1.13 | % | * | | | | | | | | executive officers as
a group (23 persons) | | B | | 24,565 | — | | 24,565 | | * | | * | | | | |
Section 16(a) Beneficial Ownership Reporting Compliance
| | | | | | Shares of
Class A and
Class B Stock
Beneficially
Owned(1) | | Additional
Shares
Beneficially
Owned(2) | | Totals | | Percent
of
Class(1) | | Percent
of
Total
Voting
Power | | Deferred
Stock
Units(3) | | | | | | | | | | | | | | | | | | | | | | | | | | Mark Allin(4) | | A | | | 7,618 | | | 2,951 | | | 10,569 | | | .02 | % | | — | | | — | | | | | B | | | — | | | — | | | — | | | — | | | — | | | — | | | Mari Jean Baker | | A | | | — | | | — | | | — | | | — | | | — | | | 6,170 | | | | | B | | | — | | | — | | | — | | | — | | | — | | | — | | | George Bell | | A | | | — | | | — | | | | | | — | | | — | | | 1,759 | | | | | B | | | — | | | — | | | — | | | — | | | — | | | | | | Joseph S. Heider(7) | | A | | | 15,529 | | | 2,622 | | | 18,151 | | | .04 | % | | — | | | — | | | | | B | | | — | | | — | | | — | | | — | | | — | | | — | | | Matthew S. Kissner | | A | | | — | | | — | | | — | | | — | | | — | | | 22,790 | | | | | B | | | — | | | — | | | — | | | — | | | — | | | — | | | John Kritzmacher(4) | | A | | | 12,500 | | | 12,500 | | | 25,000 | | | .05 | % | | — | | | — | | | | | B | | | — | | | — | | | — | | | — | | | — | | | | | | Raymond W. McDaniel, Jr. | | A | | | 500 | | | — | | | 500 | | | — | | | — | | | 20,995 | | | | | B | | | — | | | — | | | — | | | — | | | — | | | — | | | Eduardo Menascé | | A | | | — | | | — | | | — | | | — | | | — | | | 11,530 | | | | | B | | | — | | | — | | | — | | | — | | | — | | | — | | | Steven J. Miron(4)(7) | | A | | | 13,946 | | | 15,921 | | | 29,867 | | | .06 | % | | — | | | — | | | | | B | | | — | | | — | | | — | | | — | | | — | | | — | | | | | | | | | | | | | | | | | | | | | | | | |
18| | | | | | Shares of
Class A and
Class B Stock
Beneficially
Owned(1) | | Additional
Shares
Beneficially
Owned(2) | | Totals | | Percent
of
Class(1) | | Percent
of
Total
Voting
Power | | Deferred
Stock
Units(3) | | | | | | | | | | | | | | | | | | | | | | | | | | William J. Pesce | | A | | | 63,008 | | | — | | | 63,008 | | | .13 | % | | — | | | — | | | | | B | | | — | | | — | | | — | | | — | | | — | | | — | | | William B. Plummer | | A | | | — | | | — | | | — | | | — | | | — | | | 34,175 | | | | | B | | | — | | | — | | | — | | | — | | | — | | | — | | | John W. Semel(4) | | A | | | 10,997 | | | 5,000 | | | 15,997 | | | .03 | % | | — | | | | | | | | B | | | — | | | — | | | — | | | — | | | — | | | — | | | Stephen M. Smith(4)(7) | | A | | | 93,137 | | | 33,110 | | | 126,247 | | | .26 | % | | — | | | — | | | | | B | | | — | | | — | | | — | | | — | | | — | | | — | | | Kalpana Raina | | A | | | — | | | — | | | — | | | — | | | — | | | 9,440 | | | | | B | | | — | | | — | | | — | | | — | | | — | | | — | | | Gary Rinck(4) | | A | | | 40,886 | | | 3,933 | | | 44,819 | | | .09 | % | | — | | | — | | | | | B | | | — | | | — | | | — | | | — | | | — | | | — | | | Jesse Caleb Wiley | | A | | | — | | | — | | | — | | | — | | | — | | | — | | | | | B | | | 800 | | | — | | | 800 | | | — | | | — | | | — | | | Peter Booth Wiley(5)(6) | | A | | | 1,381,850 | | | — | | | 1,381,850 | | | 2.8 | % | | .1 | % | | — | | | | | B | | | 2,727,154 | | | — | | | 2,727,154 | | | 29 | % | | 19 | % | | — | | All directors and executive
officers as a group | | A | | | 1,681,558 | | | 71,091 | | | 1,752,649 | | | 3.56 | % | | .12 | % | | — | | | (24 persons) | | B | | | 2,727,954 | | | — | | | 2,727,954 | | | 29 | % | | 19 | % | | — | |
| (1) | This table is based on the information provided by the individual directors or executives. | | | (1) This table is based on the information provided by the individual directors or named executive officers as of August 4, 2017. In the table, percent of class was calculated on the basis of the number of shares beneficially owned as determined in accordance with Rule 13d-3 under the Securities Exchange Act of 1934, divided by the total number of shares issued and outstanding plus the number of shares of the class issuable to the individual director or executive officer pursuant to the options exercisable under the Company’s stock option plans on or before October 3, 2015. |
| (2) | Shares issuable pursuant to options exercisable under the Company’s stock option plans on or before October 3, 2015. |
| (3) | This amount represents the number of shares of Class A Stock credited to the participating director’s account pursuant to the Deferred Compensation Plan for Directors’ Fees, described on page 52. The shares will be issued upon the director’s retirement. |
| (4) | Includes Class A shares of restricted stock subject to forfeiture awarded under the Company’s long-term incentive plans as follows: Mr. Allin, 2,951 shares; Mr. Kritzmacher, 12,500 shares; Mr. Miron 15,921 shares; Mr. Rinck 3,933 shares, Mr. Smith, 33,110 shares and Mr. Semel 5,000 shares. |
| (5) | Peter Booth Wiley, as a co-trustee with Bradford Wiley II and Deborah E. Wiley, of the E.P. Hamilton Trusts, LLC shares one-third voting and investment power with respect to 462,338 shares of Class A Stock and 8,125,536 shares of Class B Stock. For purposes of this table, Mr. Wiley is shown as the beneficial owner of 154,112 shares of Class A Stock and 2,708,512 Class B Stock, representing one-third of the holdings of E.P. Hamilton Trusts, LLC in such shares of Class A Stock and Class B Stock. |
| (6) | Peter Booth Wiley, as co-trustee with Bradford Wiley II and Deborah E. Wiley, share voting and investment power with respect to 55,072 shares of Class A Stock and 36,720 shares of Class B Stock under the Trust of Esther B. Wiley. For purposes of this table, each is shown as the owner of one-third of these shares. |
| (7) | Mr. Heider separated service from Wiley on August 7, 2015. Mr. Miron separated service from Wiley on November 30, 2014. Mr. Smith retired on June 1, 2015. |
Section 16(a) of the Securities Exchange Act of 1934, requiresdivided by the total number of shares issued and outstanding.
| | | | | | (2) Shares issuable pursuant to options exercisable under the Company’s stock option plans on or before October 3, 2017. | | | | | | (3) Each share of Class A Common Stock is entitled to one-tenth (1/10) of one vote and each share of Class B Common Stock is entitled to one vote. |
| | | | | (4) This amount represents the number of share equivalents of Class A Stock credited to the participating director’s account pursuant to the Director Deferred Compensation Plan (the “Plan”), described on page 51. Deferred shares are issued under the Plan upon the participating director’s retirement and pursuant to the distribution election made by the director. Distributions are made annually on January 15th in Class A Common Stock after a Director has retired from the Board. | | | | | | (5) Includes 64,970 shares held indirectly through a GRAT trust. | | | |
| | (6) Includes 100 shares held indirectly though a trust. | | | | | | Section 16(a) Beneficial Ownership Reporting Compliance | | | | | | Section 16(a) of the Exchange Act and related regulations require our directors, executive officers, and directors, and persons who ownbeneficial owners holding more than ten percent10% of a registered classour common stock to report their initial ownership of the Company’s equity securities, to file reports of ownershipour common stock and any changes in that ownership with the Securities andExchange Commission and the New York Stock Exchange.SEC. Officers, directors and greater than ten percent10% shareholders are required by SEC regulation to furnish the Company with copies of all Section 16(a) forms they file.
Based on We assist our review we believe that during Fiscal 2015, our directors, executive officers, and greater than ten percent beneficial owners met all filing10% shareholders complying with these requirements.
Based solely upon a review of the copies of these reports furnished to us and written representations from such NEOs, directors and stockholders, with respect to the Fiscal 2017 period, we are not aware of any required Section 16(a) reports that were not filed on a timely basis, except that, due to administrative oversights, required Form 4 reports were not filed on a timely basis on behalf of the following persons relating the acquisition of shares upon the vesting of earned performance share units in June 2016: Mark J. Allin, Reed Elfenbein, John A. Kritzmacher, Joan O’Neil, Vincent Marzano, Gary M. Rinck, John Semel, Clay Stobaugh, and Jeffrey Sugerman. | | | | | | REPORT OF THE AUDIT COMMITTEE | | | | | | The following is the report of the Audit Committee of the Company with respect to the Company’s audited financial statements for the fiscal year ended April 30, 2015.2017. | | | | | | Fees of Independent Auditor | | | | | | Audit Fees | | | | | | Total aggregate fees billed by KPMG LLP (“KPMG”) for professional services in connection with the audit and review of the Company’s Consolidated Financial Statements, and statutory audits of the Company’s international subsidiaries were $2,484,000$2,525,000 and $2,379,000$2,939,000 in fiscal years 20152017 and 2014,2016, respectively. | | | | | | Audit Related Fees | | | | | | The aggregate fees billed for audit related services, including due diligence related to acquisitions, employee benefit plan audits, and consultation on acquisitions and information technology were $106,000$262,000 and $106,900$ 108,400 in fiscal years 20152017 and 2014,2016, respectively. | | | | | | Tax Fees | | | | | | The aggregate fees billed for services rendered by KPMG tax personnel, except those services specifically related to the audit of the financial statements, were $241,000$346,000 and $307,000$277,000 in fiscal years 20152017 and 2014,2016, respectively. Such services include tax planning, tax return reviews, advice related to acquisitions, tax compliance and compliance services for expatriate employees. | | | | | | Other Non-Audit Fees | | | | | | The aggregate non-audit fees were $0 and $0 in fiscal years 20152017 and 2014,2016, respectively. |
| | The Audit Committee has advised the Company that in its opinion the services rendered by KPMG LLP are compatible with maintaining their independence. |
| | The Audit Committee is responsible for oversight of the Company’s accounting, auditing and financial reporting process on behalf of the Board of Directors. The Committee consists of threefour members who, in the judgment of the Board of Directors, are independent and financially literate, as those terms are defined by the Securities and Exchange Commission (the “SEC”)SEC and the listing standards of the New York Stock Exchange (the “NYSE”).NYSE. The Board of Directors has determined that all the members of the Committee satisfy the financial expertise requirements and three of the four members have the requisite experience to be designated “audit committee financial experts” as that term is defined by the rules of the SEC and the NYSE. | | | | | | Management has the primary responsibility for the preparation, presentation and integrity of the financial statements of the Company; for maintaining appropriate accounting and financial reporting policies and practices; and for internal controls and procedures designed to assure compliance with generally accepted US accounting standards and applicable laws and regulations. The Committee is responsible for the oversight of these processes. In this fiduciary capacity, the Committee has held discussions with management and the independent auditors regarding the fair and complete presentation of the Company’s results for the fiscal year ended April 30, 2015.2017. Management has represented to the Committee that the Company’s financial statements were prepared in accordance with generally accepted US accounting principles. The Committee has discussed with the independent auditors significant accounting principles and judgments applied by management in preparing the financial statements as well as alternativetreatments. The Committee discussed with the independent auditors the matters required to be discussed by Statement onpursuant to Public Company Accounting Oversight Board Auditing StandardsStandard No. 61 (Communication16 (Communications with Audit Committees). | | | | | | The Audit Committee has had discussions with, and received regular status reports from, the independent auditors and the Vice President of Internal Audit regarding the overall scope and plans for their audits of the Company, including their scope and plans over management’s assessment of the effectiveness of internal control over financial reporting. The independent auditors provided the Audit Committee with written disclosures and the letter required by applicable professional and regulatory standards relating to KPMG’s independence from the Company, including the Public Company Accounting Oversight Board pertaining to the independent accountant’s communication with the Audit Committee concerning independence, and the Audit Committee discussed with the independent auditors their independence. | | | | | | The Committee also considers whether providing non-audit services is compatible with maintaining the auditor’s independence. The Audit Committee has adopted a policy of pre-approving all audit and non-audit services performed by the independent auditors. The Audit Committee may delegate authority to one or more of its members to grant pre-approvals of non-auditnon- audit services, provided that the pre-approvals are presented to the Audit Committee for ratification at its next scheduled meeting. | | | | | | Persons with complaints or concerns about accounting, internal controls or auditing matters may contact the Audit Committee by addressing a letter to: Chairman of the Audit Committee, John Wiley & Sons, Inc., P. O. Box 1569, Hoboken, NJ 07030-5774.at tellthedirectors@wiley.com. | | | | | | Based upon the review and discussions referred to above, the Committee recommended to the Company’s Board of Directors that the audited financial statements be included in the Company’s Annual Report on Form 10-K for the fiscal year ended April 30, 2015,2017, as filed with the Securities and Exchange Commission. | | | | | | Audit Committee Raymond W. McDaniel, Jr., Chairman,
| | | | | | Mari Jean Baker, Chair, David C. Dobson, William B. Plummer, and Eduardo MenasceKalpana Raina |
21
| | EXECUTIVE COMPENSATIONReport of the Compensation Committee | | | | | | The Compensation Committee has reviewed and discussed with Company management the Compensation Discussion and Analysis found on pages 2326 through 5251 of this Proxy Statement. Based on this review and discussion, the Compensation Committee has recommended to the Board of Directors that the Compensation Discussion and Analysis be included in the Company’s Annual Report on Form 10-K and this Proxy Statement. | | | | | | Executive Compensation and Development Committee Kalpana Raina,
| | | | | | Raymond W. McDaniel, Jr., Chair, George Bell, and William B. PlummerLaurie A. Leshin | | | | | | Compensation Committee Interlocks and Insider Participation | | | | | | No member of the Compensation Committee has served as one of our officers or employees at any time. None of our executive officers serves as a member of the Compensation Committee of any other company that has an executive officer serving as a member of our Board of Directors. None of our executive officers serves as a member of the board of directors of any other company that has an executive officer serving as a member of our Board’s Compensation Committee.
| | | | | | Performance Graph | | | | | | 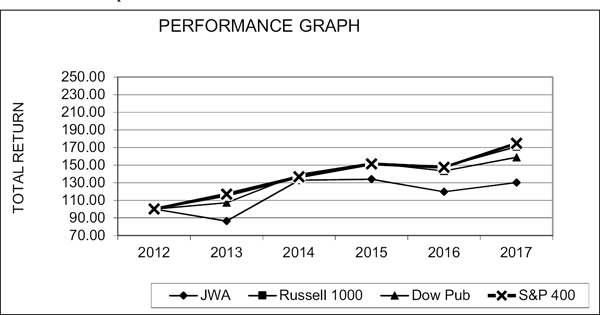 |
|
| | | JWA | Russell
1000 | Dow Pub | S&P 400 | | | Apr-12 | 100.00 | 100.00 | 100.00 | 100.00 | | | Apr-13 | 86.38 | 114.66 | 107.29 | 117.02 | | | Apr-14 | 132.70 | 135.77 | 139.50 | 136.78 | | | Apr-15 | 133.95 | 150.49 | 152.33 | 151.33 | | | Apr-16 | 119.69 | 147.87 | 143.24 | 147.45 | | | Apr-17 | 130.20 | 170.97 | 158.75 | 174.79 |
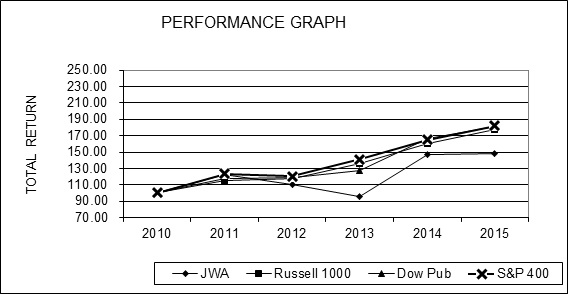
| | | | 2010 | | | 2011 | | | 2012 | | | 2013 | | | 2014 | | | 2015 | | | John Wiley & Sons, Inc. Class A | | $ | 100.00 | | $ | 122.26 | | $ | 110.35 | | $ | 95.32 | | $ | 146.43 | | $ | 147.82 | | | Russell 1000 | | | 100.00 | | | 115.78 | | | 118.08 | | | 135.39 | | | 160.32 | | | 177.70 | | | Dow Jones Publishing Index | | | 100.00 | | | 118.16 | | | 119.01 | | | 127.68 | | | 166.02 | | | 181.29 | | | S&P 400 Midcap | | | 100.00 | | | 123.35 | | | 120.44 | | | 140.94 | | | 164.75 | | | 182.27 | |
| | The above graph provides an indicator of the cumulative total return to shareholders of the Company’s Class A Common Stock as compared with the cumulative total return on the Russell 1000, the Dow Jones Publishing Index and the S&P 400 Midcap, for the period from April 30, 20102012 to April 30, 2015.2017. The Company has elected to use the Russell 1000 Index and the S&P 400 Midcap index as its broad equity market indices because it is currently included in these indices. Cumulative total return assumes $100 invested on April 30, 20102012 and reinvestment of dividends throughout the period. |
| | Fiscal 20152017 Compensation Discussion & Analysis | | | | | | Introduction | | | | | | This Compensation Discussion and Analysis, or “CD&A,” describes the Fiscal 20152017 compensation program for Wiley’s executive officers. The overarching goals that guide the design and administration of our executive compensation program consist of the ability to: | ·are: | | | | | | ● Recruit and retain the highest caliber of executive talent by offering a competitive compensation program; |
| · | | | | | | ● Motivate and reward executives for achieving strategic and financial objectives, which drive shareholder value, through the use of annual cash incentives; and |
| · | | | | | | ● Align executives’ and shareholders’ interests through awards of equity that are dependent upon the performance of the Company and encourage the acquisition of a significant ownership stake in the Company. |
| | | | | | This CD&A describes how the Compensation Committee of the Board of Directors considered our business strategy, our compensation philosophy, and the overarching goals that guide our executive compensation program to arrive at Fiscal 20152017 compensation decisions for our executives, including our named executive officers (“NEOs”), whose compensation is set forth in the 20152017 Summary Compensation Table and other compensation tables contained in this proxy statement. | | | | | | Our Fiscal 20152017 NEOs are: | · | Stephen M. Smith, President and Chief Executive OfficerMr. Smith retired on June 1, 2015 | | | | | | ● Mark J. Allin,President and Chief Executive Officer Mr. Allin’s employment terminated on May 8, 2017 |
| · | Mark J. Allin, Executive Vice President, Professional Development (from May 1, 2014 through February 9, 2015), Executive Vice President, Chief Operating Officer and Acting Chief Executive Officer (from February 10, 2015 through May 31, 2015)Mr. Allin became President and Chief Executive Officer on June 1, 2015 | | | | | ● John A. Kritzmacher,Chief Financial Officer & Executive Vice President, Technology and Operations | |
| · | John A. Kritzmacher, Executive Vice President, Chief Financial and Operations Officer | | | |
| · | | | ● Gary Rinck,, Executive Vice President, General Counsel |
| · | Joseph S. Heider | | | | | ● John W. Semel, Executive Vice President, Global EducationMr. Heider’s position was discontinued, and he separated service from Wiley on August 7, 2015 | |
| · | John W. Semel, Senior Vice President, Planning and DevelopmentMr. Semel was named Executive Vice President and Chief Strategy Officer on May 1, 2015 |
| · | Former NEO: Steven J. Miron, Executive Vice President, Global ResearchMr. Miron’s position was discontinued, and he separated service from Wiley on November 30, 2014 |
All references to President and Chief Strategy Officer Mr. Semel’s employment terminated on June 30, 2017
| | | | | | ● Jeffrey L. Sugerman,Executive Officer or CEO in the remainder of this CD&A apply to Vice President, Talent Solutions and Education Services Mr. Smith.Sugerman retired on July 31, 2017 | | | | | | Executive Summary | | | | | Fiscal Year Highlights | | The Company delivered on itsFull year revenue of $1,719 million and earnings guidance foradjusted Earnings per Share (EPS) of $3.00 rose 2% and 13%, respectively, excluding the year. Revenue grew 4% on a constant currency basisimpact of foreign exchange. Results were largely due to the transitional impact of shifting to time-based journal subscriptions and contributions from recent acquisitions. Excluding those items and other unusual charges and credits, revenue declined 1% and adjusted EPS rose 10%1%, both at constant currency. Revenue and EPS on a US GAAP basis were flat and down 21%, respectively, with GAAP EPS performance primarily due to $3.26. Oura large, unfavorable tax decision in Germany.
Segment Results. Research, our largest and most profitable business, Research journals (‘Research Communication’),segment (50% of revenue) delivered 4% revenue growth for the year on a constant currency basis. Our digital solutions businesses also contributed to our revenue growth. Digital products and services made up 60% of total Wiley revenues for the year, up from 55% in Fiscal 2014. Revenue growth, the continued shift to digital, and additional savings from restructuring all contributed to 9% adjusted operating income growthsteady operational performance for the year. DuringOn a currency neutral basis, Publishing revenue (37%) declined 7% due to challenges in our print book business although segment Contribution to Profit (CTP) held steady. The Solutions segment saw 14% top line growth and the tripling of its CTP on a currency neutral basis, the result of efficiency gains. Digital Evolution. Wiley continues to make significant progress in its digital evolution, increasing its digital share of total revenue to 68% from 63% a year earlier.
Cash Flow. Cash from Operations was lower than prior year by $35 million due to unfavorable timing involving working capital (timing of end-of-year payments and collection lags) and an unbudgeted $7 million contribution to our UK pension just before year-end. The working capital impacts will unwind in Fiscal 2015, we2018. Free Cash Flow excluding composition and product development costs were lower due to lower cash from operations combined with higher capex (+$17 million) mostly related to Wiley’s headquarters transformation.
|
| Return to Shareholders. In the year, Wiley repurchased 1.1 millionapproximately 953,000 shares for $62$50.3 million, an average cost of $57.26,$52.80, and in June 2014, we increased theits quarterly dividend by 16%3% to $0.29. We continued$0.31 per share. It was the 23rd consecutive annual increase and raised the annualized dividend payout to expand Wiley’s depth and breadth as a provider$1.24 per share. As of knowledge-enabled solutions, acquiring two companiesApril 30, 2017, the Company had nearly 3.8 million shares remaining in calendar year 2014 – CrossKnowledge, a learning solutions provider focused on leadership and managerial skills development; and Profiles International, a pre-hire assessment and talent management provider. Both position Wiley to become a solutions leaderthe repurchase program announced in professional learning and development. Through organic investment and targeted acquisitions, and by integrating content, technology, and services, we have accelerated the execution of our strategy to provide professionals, students, and researchers with valued solutions that serve their needs from education through employment.June 2016.
Some noteworthy business highlights during Fiscal 2015 include:
| · | Revenue of $1.822 billion (+4% growth on a constant currency basis) |
| · | Steady growth in the Research segment coming from journals subscriptions, funded access, and other journal revenue |
| · | Strong growth in Professional and Education solutions, including Online Training, Assessment and Test Preparation, Online Program Management (Deltak), and WileyPLUS |
| · | Share of revenue from digital and solutions now at 60% of revenue; print book revenue share down to 25% |
| · | Adjusted Earnings Per Share (“EPS”) of $3.26 (+10% growth on a constant currency basis) |
| · | Free cash flow (“FCF”) of $247M, a decrease of $4M over prior year due to increased investment in technology and restructuring payments related to severance |
| · | The acquisitions of Profiles International and CrossKnowledge help to create an end-to-end talent management solution from assessment through development, a significant value proposition for customers |
We urge stockholders to read our Annual Report for the fiscal year ended April 30, 2015,2017, filed with the SEC on June 26, 2015,29, 2017, which describes our businesses and 20152017 financial results in greater detail. |
| Executive Compensation Program | | The Company’s executive compensation programs areprogram is designed to foster and maintain an experienced, motivated and aligned executive team with the ability to manage theduring all business during challenging timescycles, and to evolve the Company’s practices as changes in the market warrant. The compensation program emphasizes variable, performance-based compensation that promotes the achievement of short-term and long-term business objectives aligned with the Company’s business strategy, and rewards performance when those objectives are met. The Fiscal 2015 annual and long-term incentive programs were structured so that actual realized compensation was aligned with Company performance based on key metrics such as corporate and business revenue, EPS, business contribution to profit (“CTP”), FCF, Company stock price, and strategic objectives that benefited the Company in Fiscal 2015 and will benefit the Company in the future. We believe these metrics are aligned with driving long-term shareholder value and provide appropriate line-of-sight.Superior
| | | | | | Strong performance by our executive officers is essential to achieving our goal of increasing shareholder value. The charts below illustrate the mix of target total direct compensation for Fiscal 2015 for our President and Chief Executive Officer (“CEO”) and, on average, for our other NEOs.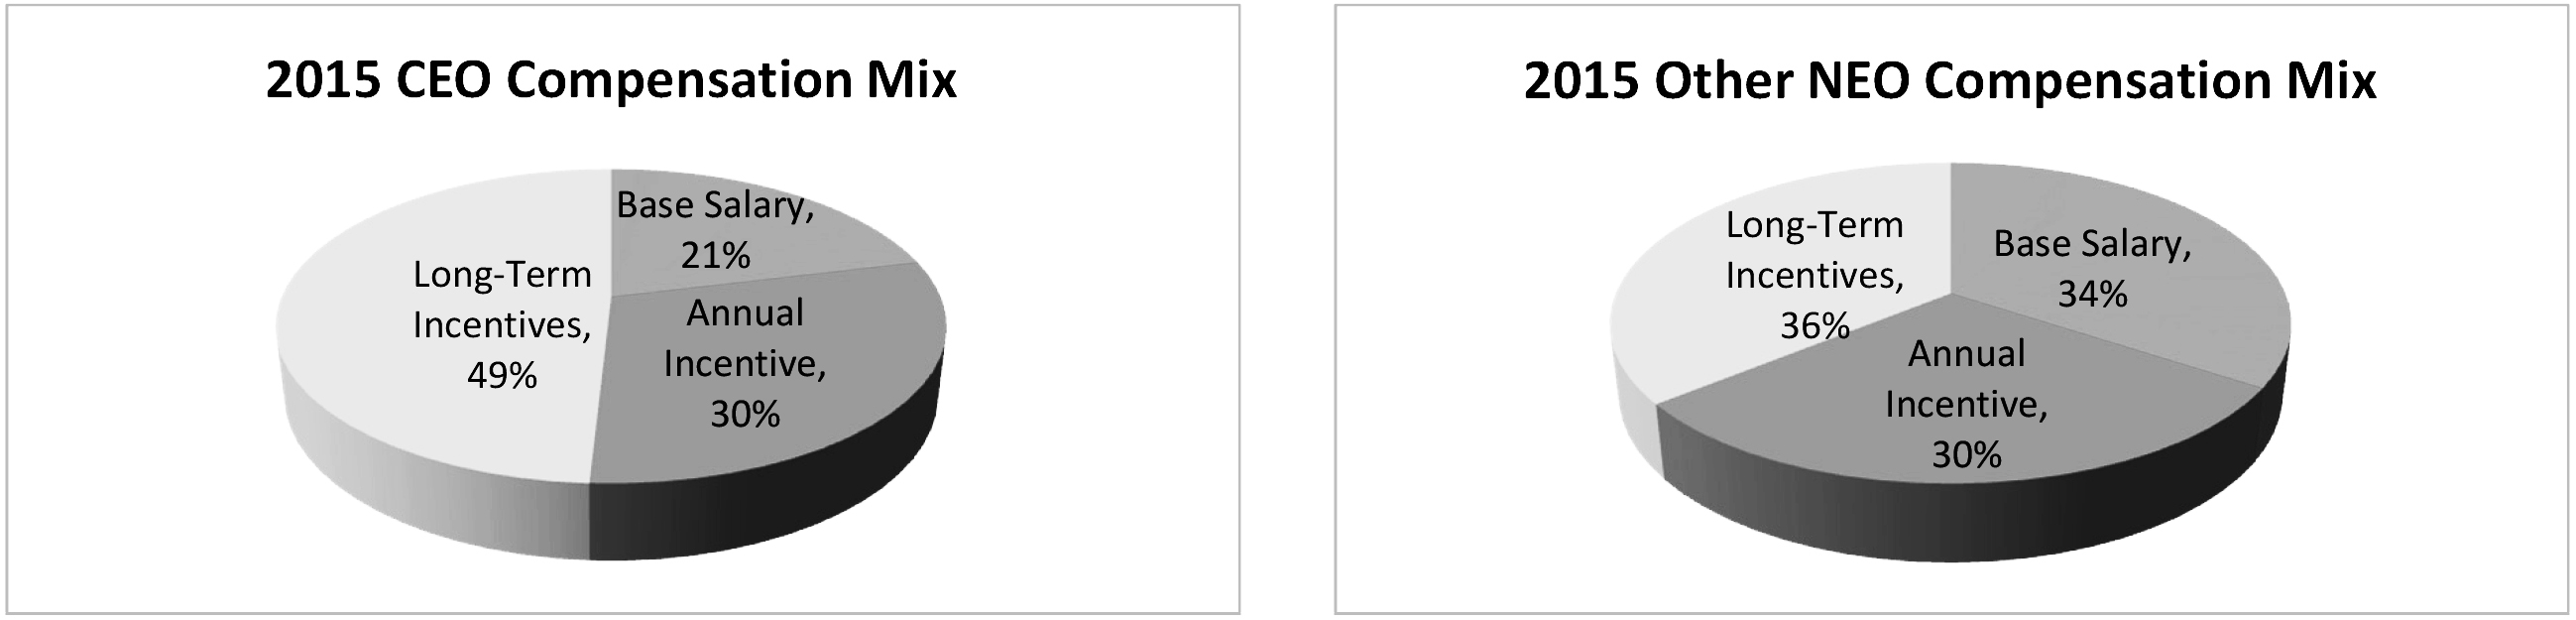
To ensure alignment between executive and shareholder rewards,Accordingly, approximately 80% of our CEO’s target total direct compensation for Fiscal 20152017 was at risk, and on average 66%approximately 70% of our other NEOsNEOs’ target total direct compensation for Fiscal 20152017 was at risk. The targeted annual incentive compensation was payable based on achievement of performance-based financial measures and strategic objectives, and performance-based equity comprised 50%60% of the targeted long-term incentive compensation.
The following chart provides a brief summarycharts below illustrate the mix of the principal elements of the Company’s executivetarget total direct compensation program for Fiscal 2015,2017 for our CEO and, on average, for our other NEOs. |
| | 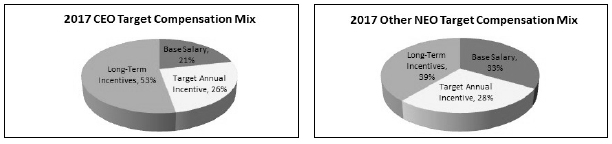 | |
The following chart provides a brief summary of the principal elements of the Company’s executive compensation program for Fiscal 2017, which are described in more detail later in this CD&A. Compensation
Element | Form | Compensation
Objective | Relation
to Performance | 2015
Actions / Results | Base Salary
(Discussed in greater detail on page 33.
| CompensationElement | | | Form | | | Compensation
Objective | | | Relation to
Performance | | | Fiscal 2017
Actions / Results | | Base Salary (Discussed in greater detailon page 34.) | | | Fixed annual cash, paid on a semi-monthly basis. | | | Fixed compensation that is externally competitive with median market rates, and allows us to attract and retain executive talent. | | | Increases in base salary reflect market positioning, economic conditions, and the Compensation Committee’s assessment of Company and individual performance over the prior year. | | | The Company’s budget for US salary increases was a total of 2.5%, including a merit budget of 2%, with a range of 0-4%, and an additional 0.5% for promotions and market adjustments. Salary increases for the NEOs ranged from 0.9% to 4.0%, with an average of 1.9%. | | Annual Incentives (Discussed in greater detail on page 35.) | | | Variable, performance-based cash bonus, paid on an annual basis. | | | Motivate the executive to contribute to the Company’s success in achieving annual corporate and business financial goals and strategic objectives. | | | 75% of the target annual incentive is based on financial goals, including corporate and business revenue, EPS and business contribution to profit (“CTP”) | Fixed annual cash, paid on a semi-monthly basis | Fixed compensation that is externally competitive with median market rates, and allows us to attract and retain executive talent. | Increases in base salary reflect market positioning, economic conditions, and the Compensation Committee’s assessment of Company and individual performance over the prior year. | The Company’s budget for US salary increases was a total of 3.25%, including a merit budget of 2.5%, with a range of 0-5%, and an additional 0.75% for promotions and adjustments. Salary increases for the NEOs ranged from 2.9% to 5.4%. | Annual Incentives
(Discussed in greater detail on page 33.)
| Variable, performance-based cash bonus, paid on an annual basis | Motivate the executive to contribute to the Company’s success in achieving annual corporate and business financial goals and strategic objectives. | 75% of the target annual incentive is based on financial goals, including corporate and business revenue, EPS, business CTP, and FCF. The remaining 25% of the target annual incentive is based on achievement of strategic objectives that are intended to further the Company’s success.
Payout can range from 0% to 150% of target. | | | Target incentives for the NEOs range from 75% to 120% of base salary. Actual short-term incentives earned by the NEOs ranged from 108% to 125% of target. | Target incentives for the NEOs range from 75% to 140% of base salary.
Actual short-term incentives earned by the NEOs ranged from 71.6% of target to 100.8% of target.
| Long-Term Stock-Based Incentives
(Discussed in greater
detail on page 35.)
| Performance share units granted each year with a 3-year performance cycle. If earned, share units continue to be subject to time-based vesting conditions and are payable as equivalent Class A shares upon vesting 50% on April 30th of the fourth and fifth years after grant | Motivates the executive to contribute to the Company’s success in achieving long-term corporate financial goals that drive shareholder value. | EPS and cumulative FCF are the performance measures used, with a weight of 60% and 40%, respectively.
Payout can range from 0% to 150% of target.
| NEOs received approximately 50% of their target long-term value in performance share units for the Fiscal 2015-17 performance cycle.
For the Fiscal 2013-15 cycle that just ended, the NEOs earned 41.7% of their targeted performance shares.
| | | | | |
Compensation
Element | Form | Compensation
Objective | Relation
to Performance | 2015
Actions / Results | | Non-qualified stock options granted each year, with vesting 50% on April 30th of the fourth and fifth years after grant | Ensures alignment of executive and shareholder interests and rewards increases in stock price. | Exercise price of non-qualified stock options is fair market value on date of grant. Accordingly, the increase in value of non-qualified stock options is directly dependent on improvements in stock price. | June 2014 grants of non-qualified stock options represent approximately 30% of the NEOs’ target long-term value. | | Restricted share units granted each year, payable as equivalent Class A shares upon vesting 50% on April 30th of the fourth and fifth years after grant | Promotes retention objective and facilitates stock ownership, expediting achievement of the stock ownership multiple. | The value of restricted share units is directly correlated with improvements in stock price. | June 2014 grants of restricted share units represent approximately 20% of the NEOs’ target long-term value.
| | Long-Term Stock-Based Incentives (Discussed in greater detail on page 36.) | | | Performance share units are granted each year and have a 3-year performance cycle. Earned performance share units are payable at the end of the performance cycle – 50% as equivalent Class A shares, and 50% as restricted share units. Such restricted share units vest on April 30th of the following year to equivalent Class A shares. | | | Motivates the executive to contribute to the Company’s success in achieving long-term corporate financial goals that drive shareholder value. | | | Cumulative earnings before interest, taxes, depreciation and amortization (“EBITDA”) and cumulative FCF are the performance measures used, with a weight of 60% and 40%, respectively. Payout can range from 0% to 150% of target. | | | NEOs received 60% of their target long-term value in performance share units for the Fiscal 2017-19 performance cycle. For the Fiscal 2015-17 cycle that just ended, the NEOs did not earn any of their targeted performance shares. | | | | | Restricted share units granted each year, payable as equivalent Class A shares upon vesting 25% per year on April 30th. | | | Promotes retention objective and facilitates stock ownership, expediting achievement of the stock ownership multiple. | | | The value of restricted share units is directly correlated with improvements in stock price. | | | June 2016 grants of restricted share units represent approximately 40% of the NEOs’ target long-term value. | | | | | | | | | | | | | | | | | |
The Company also provides the following health and retirement benefits to our senior executives, as described in more detail later in this CD&A: Benefit | Form | Purpose | Health and Welfare Benefits
(Discussed in greater detail on page 38.)
| Flexible benefits program provided to all US employees, where “flex dollars” are provided to help pay the cost of health insurance, life, disability and AD&D insurance. | Health and welfare benefits are market competitive and are provided primarily for the safety and well-being of the executive and his/her family. | Retirement Plans
(Discussed in greater detail on page 37.)
| Qualified Defined Contribution Savings Plan (401(k)), provided to all US employees | Benefit | | | Form | | | Purpose | | | Health and Welfare Benefits (Discussed in greater detail on page 39.) | | | Flexible benefits program provided to all US employees, where “flex dollars” are provided to help offset the cost of health insurance, life, disability and AD&D insurance | | | Health and welfare benefits are market competitive and are provided primarily for the safety and well-being of the executive and his/her family. | | | Retirement Plans (Discussed in greater detail on page 38.) | | | Qualified Defined Contribution Savings Plan (401(k)), provided to all US employees | | | Qualified savings plan benefits, including company basic, matching and discretionary contributions, are market competitive and provide post-retirement income for the executive. Company contributions to the US-based 401(k) were enhanced following the cessation of accruals and freeze of participation in the US defined benefit retirement plans, effective July 1, 2013. | | Qualified Defined Benefit Retirement Plan, provided to US employeeshired before July 2012 | Qualified retirement plan benefits provide additional post-retirement income for executives hired before July 2012.
The Company ceased accruals and froze participation in the US Retirement Plan, effective June 30, 2013.
| | Non-qualified Supplemental Benefit Plan (the “Excess Plan”), provided to US employees hired before July 2012 with pay in excess of IRC section 401(a)(17) limit on eligible compensation | Restores benefits lost under the qualified Retirement Plan due to limitations imposed by Internal Revenue Code regulations to the same level as other colleagues who are not restricted by Internal Revenue Code limitations.
The Company ceased accruals and froze participation in the Excess Plan, effective June 30, 2013.
| | Non-qualified Supplemental Executive Retirement Plan (the “SERP”) | Provides executives who entered the SERP prior to June 2013 with enhanced retirement income due to tax rules governing qualified retirement plans that place significant limitations on the benefits which can be paid to executives.
The Company ceased accruals and froze participation in the SERP, effective June 30, 2013.
| | | | | | Qualified Defined Benefit Retirement Plan, provided to US employees hired before July 2012 | | | Qualified retirement plan benefits provide additional post-retirement income for executives hired before July 2012. The Company ceased accruals and froze participation in the US Retirement Plan, effective June 30, 2013. | | | | | | Non-qualified Supplemental Benefit Plan (the “Excess Plan”), provided to US employees hired before July 2012 with pay in excess of IRC section 401(a)(17) limit on eligible compensation | | | Restores benefits lost under the qualified Retirement Plan due to limitations imposed by Internal Revenue Code regulations to the same level as other colleagues who are not restricted by Internal Revenue Code limitations. The Company ceased accruals and froze participation in the Excess Plan, effective June 30, 2013. | | | | | | Non-qualified Supplemental Executive Retirement Plan (the “SERP”) | | | Provides executives who entered the SERP prior to June 2013 with enhanced retirement income due to tax rules governing qualified retirement plans that place significant limitations on the benefits which can be paid to executives. The Company ceased accruals and froze participation in the SERP, effective June 30, 2013. | | | | | | Non-qualified Deferred Compensation Plan (“DCP”) | | | Enables US executives to prepare for future financial security by allowing the deferral of otherwise taxable income on a pre-tax basis, with various investment options and flexible payment options. Provides for Company contributions mirroring those made under the qualified Savings Plan. Company contributions to the DCP were enhanced following the cessation of accruals and freeze of participation in the US defined benefit retirement plans, effective July 1, 2013. | | | | | | The John Wiley & Sons Limited Retirement Benefits Scheme (“UK Qualified Plan”) | | | Approved (qualified) retirement plan benefits are market competitive and provide retirement income for UK employees on a defined benefit basis in addition to providing an incentive for a long-term career with the Company. This scheme is closed to new entrants and accruals based on service froze as of April 30, 2015. | | | | | | The Unapproved Supplemental UK Plan (the “UK Non-Qualified Plan”) | | | Restores benefits “lost” under the UK Qualified Plan due to limitations imposed by the UK Revenue authorities to the same level as other colleagues in the UK Qualified Plan who are not affected by those restrictions. This UK Non-Qualified Plan was closed to new entrants and accruals based on service froze as of April 30, 2015. | | | Perquisites (Discussed in greater detail on page39.) | | | Financial planning, tax preparation, club membership | | | Limited perquisites are provided primarily for the financial security and productivity of the executive. | | | | | | | | | | | | |
Benefit | Form | Purpose | | Non-qualified Deferred Compensation Plan (“DCP”) | Enables US executives to prepare for future financial security by allowing the deferral of otherwise taxable income on a pre-tax basis, with various investment options and flexible payment options. Provides for Company contributions mirroring those made under the qualified Savings Plan.
Company contributions to the DCP were enhanced following the cessation of accruals and freeze of participation in the US defined benefit retirement plans, effective July 1, 2013.
| | The John Wiley & Sons Limited Retirement Benefits Scheme (“UK Qualified Plan”) | Approved (qualified) retirement plan benefits are market competitive and provide retirement income for UK employees on a defined benefit basis in addition to providing an incentive for a long-term career with the Company. This scheme is closed to new entrants and accruals based on service froze as of April 30, 2015. | | The Unapproved Supplemental UK Plan (the “UK Non-Qualified Plan”) | Restores benefits “lost” under the UK Qualified Plan due to limitations imposed by the UK Revenue authorities to the same level as other colleagues in the UK Qualified Plan who are not affected by those restrictions. This UK Non-Qualified Plan was closed to new entrants and accruals based on service froze as of April 30, 2015. | Perquisites
(Discussed in greater detail on page 38.)
| Financial planning, tax preparation, health club membership | Limited perquisites are provided primarily for the financial security and productivity of the executive. |
The table below highlights our current compensation practices – those we have implemented because we believe they drive performance and are aligned with sound governance standards – and those we have not implemented because we do not believe they would serve our shareholders’ long-term interests. | Executive Compensation Practices
We Have Implemented
(What We Do) | Executive Compensation Practices
We HaveNot Implemented
(What We Don’t Do) | | ü | We ensure a correlation between pay and performance by having a significant portion of compensation that is performance-based and at-risk. Payment of the performance-based compensation is based on achievement of corporate and business financial goals and individual performance against pre-set strategic objectives. Different financial metrics are used in our annual and long-term incentive plans. | Executive Compensation Practices We Have
Implemented (What We Do) | Executive Compensation Practices
We HaveNot Implemented
(What We Don’t Do) | √ | We ensure a correlation between pay and performance by having a significant portion of compensation that is performance-based and at-risk. Payment of the performance-based compensation is based on achievement of corporate and business financial goals and individual performance against pre-set strategic objectives. | X | We prohibit the repricing of stock options and stock appreciation rights without shareholder approval. We also do not allow cash buyouts for underwater stock options or stock appreciation rights without shareholder approval. | √ | We review industry and general industry survey data when setting compensation for our executive officers. | X | We do not pay dividends on unearned performance-based equity awards. | √ | We mitigate risk by:
·placing substantial emphasis on long-term equity-based incentives;
·setting performance levels that correspond to a range of payments for performance-based compensation;
·capping payouts of annual and long-term performance-based compensation;
·including clawback provisions in our annual and long-term incentive plans;
| X | We prohibit the repricing of stock options and stock appreciation rights without shareholder approval. We also do not allow cash buyouts for underwater stock options or stock appreciation rights without shareholder approval. | | ü | We review general and technology industry survey data, along with custom peer group information, when setting compensation for our executive officers. | X | We do not pay dividends on unearned performance-based equity awards. | | ü | We mitigate risk by: | X | We do not maintain compensation programs that we believe create risks reasonably likely to have a material adverse effect on the Company. |
| ● | conducting an annual risk assessment; | | | | | | | | | ● | setting performance levels that correspond to a range of payments for performance-based compensation; | | | | | | | | | ● | capping payouts of annual and long-term performance-based compensation; | | | | | | | | | ● | including clawback provisions in our annual and long-term incentive plans; | | | | | | | | | ● | strictly prohibiting hedging activities in our Insider Trading Policy; and | | | | | | | | | ● | requiring retention of 50% of the net shares upon exercise or vesting until the stock ownership multiple is met. | | | | | | | | | ü | We have competitive post-employment and change in control provisions that apply to all executive officers. | Executive Compensation Practices We Have
Implemented (What We Do) | Executive Compensation Practices
We HaveNot Implemented
(What We Don’t Do) | | ·strictly prohibiting hedging activities in our Insider Trading Policy;
·requiring retention of 50% of the net shares upon exercise or vesting until the stock ownership multiple is met.
| | | √ | We have competitive post-employment and change in control provisions that apply to all executive officers. | X | We do not provide significant additional health and retirement benefits to executive officers that differ from those provided to all other employees. | √ | We have double-trigger vesting of equity awards following a change in control when the acquiring company is a publicly traded company and outstanding equity is assumed or replaced. | X | We do not provide excise tax gross-ups upon a change of control. | √ | We generally provide limited perquisites that we believe are beneficial to the Company. | X | We do not provide tax gross-ups on perquisites. | √ | The Compensation Committee, currently composed of three independent directors, retains an external, independent compensation consulting firm to advise on matters related to executive compensation and governance. | X | We do not provide significant additional health and retirement benefits to executive officers that differ from those provided to all other employees. | | ü | We have double-trigger vesting of equity awards following a change in control when the acquiring company is a publicly traded company and outstanding equity is assumed or replaced. | X | We do not provide excise tax gross-ups upon a change of control. | | ü | We generally provide limited perquisites that we believe are beneficial to the Company. | X | We do not provide tax gross-ups on perquisites. | | ü | The Compensation Committee, currently composed of three independent directors, retains an external, independent compensation consulting firm to advise on matters related to executive compensation and governance. | X | The Compensation Committee’s independent compensation consulting firm does not provide any other services to the Company. |
| The following changes to our executive compensation program were implemented during Fiscal 2015:2017: | | | | | | | ● | Beginning in Fiscal 2017, 60% of each NEO’s regular annual long-term incentive opportunity was delivered in the form of performance share units, and 40% was delivered in the form of restricted share units, an increase from 50% and 20% in prior years, respectively. Stock options, previously weighted at 30%, were eliminated as a form of long-term incentive beginning in Fiscal 2017. The Compensation Committee believes the new mix of equity provides an appropriate balance between risk and potential reward by tying realizable compensation directly to pre-established performance goals and future increases in stock price, provides alignment with shareholder interests, and serves as an effective retention tool for executive talent. | | | | | | ● | The executive severance policy for NEOs was implemented during Fiscal 2017, to provide an appropriate level of financial protection against involuntary job loss through the provision of competitive and consistent post-termination benefits, contingent upon securing restrictive covenants such as non-compete and non-solicitation. | | | | | | · | During Fiscal 2015, a new methodology for assessing the competitiveness of our executive compensation program was implemented, including the establishment of a custom executive compensation peer group and use of the Radford Technology Survey in addition to the previously used Towers Watson General Industry Survey. In addition to providing an additional market reference, the custom peer group provides the ability to conduct research on other comparable companies’ compensation programs and policies to ensure all aspects of Wiley’s program are competitive. The introduction of the Radford Technology Survey recognizes the continued digital focus and evolution of the business and, along with the Towers Watson General Industry Survey, provides a robust combination of survey data to use for executive compensation benchmarking. This new methodology was used to make fiscal 2016 compensation decisions. |
| · | Accruals based on service under the closed UK Qualified Plan and under the UK Non-Qualified Plan were frozen as of April 30, 2015. The group of colleagues previously covered under the UK Qualified Plan commenced participation under the UK Group Personal Pension Plan (“GPPP”), a UK tax-qualified defined contribution arrangement, as of May 1, 2015. |
CEO Realizable Pay | To demonstrate the linkage between CEO pay and Company performance / changes in shareholder value, a comparison of realizable pay to reported pay and Total Shareholder Return (“TSR”) is presented below. While not intended to replace the Summary Compensation Table (“SCT”) on page 39,40, which includes targeted equity grants based on accountinggrant date values, this information includes the value realized from stock option exercises and the vesting of full-value awards during the fiscal year, and the change in the intrinsic value of outstanding equity awards as of the end of the fiscal year. SCT data is included in the chart and the accompanying table below for comparison purposes.28 Data shown are for the two years Mr. Allin was CEO. Mr. Allin’s Fiscal 2016 grants include stock awards under the Executive Long-Term Incentive Plan in addition to restricted and performance-based stock awards received upon appointment to CEO. |
| |  |
| Realizable Compensation Analysis ($000s) | | | | | | Compensation Element | | Fiscal 2016 | | Fiscal 2017 | | Cash Compensation | | | | | | | | Base Salary | | $738 | | | $775 | | | Annual Incentive Earned | | 875 | | | 1,053 | | | Total Cash Compensation | | $1,613 | | | $1,828 | | | | | | | | | | | Long-Term Incentives | | | | | | | | Value of Realized Awards at Exercise/Vesting | | $226 | | | $696 | | | Change in Value of Outstanding Awards at FYE | | 665 | | | 1,591 | | | Total | | $891 | | | $2,287 | | | Total Realizable Compensation | | $2,504 | | | $4,115 | | | Summary Compensation Table Values ($000s) | | | | | | | | Compensation Element | | Fiscal 2016 | | Fiscal 2017 | | Base Salary | | $738 | | | $775 | | | Annual Incentive | | 875 | | | 1,053 | | | Stock Awards | | 2,284 | | | 1,920 | | | Stock Options | | 499 | | | N/A | | | Total | | $4,395 | | | $3,748 | |
Realizable Compensation Analysis ($000s)
| Compensation Element | | Fiscal 2013 | Fiscal 2014 | Fiscal 2015 | | | | | | | | | | | Cash Compensation | | | | | | | | | Base Salary | | $833 | | $869 | | $913 | | | Annual Incentive Earned | | $753 | | $1,435 | | $1,137 | | | Total Cash Compensation | | $1,586 | | $2,304 | | $2,050 | | | | | | | | | | | | Long-Term Incentives | | | | | | | | Value of Realized Awards
at Exercise/Vesting | | $347 | | $1,307 | | $1,757 | | Change in Value of Outstanding
Awards at FYE | | -$1,306 | | $8,790 | | -$1,197 | | | Total | | -$958 | | $10,097 | | $559 | | | Total Realizable Compensation | | $627 | | $12,401 | | $2,609 | | | | | | | | | | | | Summary Compensation Table Values ($000s) | | | | | | | | | Compensation Element | | Fiscal 2013 | Fiscal 2014 | Fiscal 2015 | | | | | | | | | | | Base Salary | | $833 | | $869 | | $913 | | | Annual Incentive | | 753 | | 1,435 | | 1,137 | | | Stock Awards | | 961 | | 1,403 | | 1,493 | | | Stock Options | | 1,229 | | 608 | | 641 | | | Total | | $3,776 | | $4,315 | | $4,183 | |
2014
| | 2016 “Say-on-Pay” Advisory Vote on Executive Compensation | | | | | | The Company provides shareholders with an annual “say-on-pay” advisory vote to approve its executive compensation, in accordance with Section 14A of the Exchange Act. At the 20142016 Annual Meeting of Shareholders, our shareholders expressed substantial support for the compensation of our NEOs, with approximately 99.5%99% of the votes cast for approval of our executive compensation program. The Compensation Committee evaluated the results of the 20142016 advisory vote and believes the strong shareholder support signals approval of the current pay-for-performance executive compensation program and the sound governance practices in place at Wiley. As noted above in the Executive Summary, the Company has adopted governance practices that it believes best serve our shareholders, while also incorporating best practices that allow us to meet the overarching goals of our executive compensation program. In furtherance of that goal, the Compensation Committee determined to make certain changes to the executive compensation program, noted on page 28,31, in a continuing effort to reflect sound governance and market practices. |
| | Compensation Principles and Practices |
Principles of
Wiley’s Executive
Compensation Program | | The following principles and practices shaped the design and implementation of the Company’s compensation program for Fiscal 2015:2017: |
| · | The compensation mix is designed to balance emphasis on short-term and long-term performance, | ● | The compensation mix is designed to emphasize variable pay, with a significant proportion performance-based, in line with the Company’s operating and strategic plans. | | · | Compensation is merit-based in that the total compensation opportunity and actual payout for each executive is based on current responsibilities, tenure in current position, skill set relative to the external marketplace, and sustained performance against financial and strategic objectives. |
| · | There is a correlation between compensation (both annual and long-term) and the Company’s performance. Financial targets used in both the short- and long-term incentive plans are aligned with the Board-approved strategic plan and, if not achieved, result in a large percentage reduction in compensation. The program is structured such that at executive levels a larger portion of annual and total compensation is variable, driven by performance and significantly composed of stock-based compensation, ensuring a correlation between executive and shareholder rewards. |
| · | ● | Senior executives, including the NEOs, have a significant, ongoing ownership stake in the Company to strengthen the alignment of our executives’ interests with those of our shareholders. |
| · | The program is competitive with the total compensation program of competitor companies in the publishing / information / media and general industries when performance goals are achieved. To that end the Compensation Committee reviews a report based on independently researched market compensation data as a guidepost to determine whether the Company’s compensation levels and programs are competitive and meet the Company’s stated objectives. For Fiscal 2015, the report included publishing / media companies with whom Wiley competes for business and talent and for whom data is available, as well as other companies in general industry for positions that are not unique to our industry. Base salaries, annual incentive awards and long-term incentive grants are determined within the framework of position responsibilities, assessments of individual performance and future leadership potential, and competitive market data adjusted to reflect the size of the Company. As noted previously, a new methodology for assessing the competitiveness of our executive compensation program was implemented, including the establishment of a custom executive compensation peer group and use of the Radford Technology Survey in addition to the previously used Towers Watson General Industry Survey. | ● | The program is competitive with the total compensation of companies in our custom benchmarking peer group, and in comparison to companies included in the general and technology industry surveys we use to benchmark executive compensation. |
Role of Compensation
Consultant | | The Compensation Committee, currently composed of three independent directors, has engaged Frederic W. Cook & Co., Inc. (“FW Cook”) as its independent compensation consultant, to advise the Compensation Committee on matters related to executive compensation. The executive compensation consultant reports directly to the Compensation Committee, and works collaboratively with management with regard to evaluating changes to the administrationexecutive compensation program and practices, conducting any required analysis in support of the executive compensation program. |
| | program, and providing competitive benchmarking information, including determining the companies for the benchmarking peer group. In addition, FW Cook provides competitive benchmarking for non-employee director pay to the Governance Committee. FW Cook does not offer or provide any other services to the Company, and the Compensation Committee determined that the retention of FW Cook has not raised any conflict of interest. | | | | | | Following are the services provided to the Compensation Committee by FW Cook during Fiscal 2015:2017: |
| ● | Provided market and custom peer-group analysis and a competitive range of target compensation based on the Company’s compensation philosophy for executive officers, which was used for Fiscal 2017 executive compensation recommendations. The peer group compensation data is an additional reference point that supplements size-adjusted survey data for the Company’s proxy executives and provides information on executive compensation practices and competitive aggregate share usage and dilution levels. |
| · | Provide market analysis and a competitive range of target compensation based on the Company’s compensation philosophy for executive officers, to be used for Fiscal 2015 executive compensation recommendations. Confer | ● | Attended meetings as requested by the Compensation Committee, and conferred with the Compensation Committee Chair and management, as needed. | | | |
| · | Present the market analysis report with respect to Fiscal 2015 target compensation at the March 2014 Compensation Committee meeting. Attend any other meetings as requested by the Compensation Committee. |
| ● | Monitored the Company’s executive compensation program and advised the Compensation Committee of change to plans or practices to improve effectiveness, competitiveness and alignment with good corporate governance principles. FW Cook conducted a review of key design features and mechanics of the executive severance programs currently in effect among Wiley’s benchmarking peer group, which was used by the Committee and management when considering changes to the Company’s executive severance practices. |
| · | Monitor the Company’s executive compensation program and advise the Compensation Committee of plans or practices that might be modified to improve effectiveness, competitiveness and alignment with good corporate governance principles. As noted previously, Cook worked with management and the Compensation Committee to establish an executive compensation peer group and introduce a new third-party salary survey for benchmarking fiscal 2016 executive pay. |
| · | Review the Company’s executive compensation philosophy and competitive positioning for reasonableness and recommend | ● | Reviewed the Company’s executive compensation philosophy and competitive positioning for reasonableness and recommended modifications where appropriate. |
| · | Advise | ● | Advised the Compensation Committee on management proposals, as requested. |
| · | Review | ● | Reviewed the Compensation Discussion and Analysis, compensation tables and other compensation-related disclosures included in the Company’s proxy statement. |
| · | Proactively advise | ● | Proactively advised the Compensation Committee on best practices for governance of executive compensation as well as areas of concern and risk in the Company’s program. |
| · | Proactively advise | ● | Proactively advised the Compensation Committee on legislative and regulatory developments related to compensation policies and programs and compensation-related disclosure. |
| | | | Roles of the
Compensation
Committee and
Management in
Recommending
Compensation | | As described in greater detail below, individual base salaries, annual cash incentive awards and long-term incentive grant amountsaward values are determined within the framework ofbased on the executive’s position and responsibilities and impact on the Company, individual and Company / business performance, as well as with regard to timetenure in positioncurrent role and compensation positioning relative to the external marketplace. The CEO presents compensation recommendations for the other executive officers to the Compensation Committee for its review and approval. The Compensation Committee, evaluates the performancebased on an evaluation of the CEO,CEO’s performance by the Executive Committee, determines histhe CEO’s compensation, and discusses its recommendation with the Board of Directors in executive session. | | | | | | Determination of Target Compensation Levels | | | | Compensation
Philosophy | | The Company’s executive compensation program for the executive officers consists of base salary, targeted annual cash incentives expressed as a percent of base salary and targeted long-term equity awards.incentive award values. Each executive officer’s base salary, target annual cash incentive and long-term incentive award value are reviewed annually and adjusted when and if needed, based on the criteria noted above and depending on market conditions, to remain competitive with the external market. The program is designed to pay median base salaries, above-median total cash compensation for the achievement of challenging financial targets and strategic objectives, and below-median total cash compensation when those targets are not attained, thereby aligning executive compensation with shareholder interests. Third quartile levels of total direct compensation can be realized when challenging, long-term financial goals are achieved and accompanied by future share price appreciation. An executive’s position against the market may be below or above our target positioning based on a number of factors specific to the individual, including scope of responsibility, performance, tenure in position, level of experience and skill, and market conditions. |
| Compensation Benchmarking | | The Compensation Committee’s independent compensation consultant prepares an annual review of executive compensation competitiveness, using a combination of third-party surveys and a custom proxybenchmarking peer group (the latter implemented for fiscal 2016).group. For fiscal 2015,Fiscal 2017, data from the Towers Watson US Media Industry Survey and theWillis Towers Watson US General Industry Survey and the Radford Global Technology Survey were used. The Towers Watson survey data included a special cut of 43 publishingused, weighted two-thirds and information services companies in the 2013 Towers Watson US Media Industry Survey,one-third, respectively, and over 442 companies in the 2013 Towers Watson US General Industry Survey, adjusted to be appropriate for the Company’s revenue size. The data is weighted two thirds on the publishing / media industry data and one-third on general industry data, recognizing thatthe competitive market for our executives is broader than the publishing / media industry.size, as applicable. The independent compensation consultant presents its report to the Compensation Committee at its March meeting. In benchmarking compensation levels against the Willis Towers Watson and Radford survey data, the Compensation Committee considers only the aggregated survey data. Therefore, the Compensation Committee members do not consider the identity of the companies comprising the survey data to be material for this purpose. As noted previously, the Radford Technology Survey will replace the Towers Watson Media Industry Survey beginning in fiscal 2016, recognizing the evolution of our business.
| | | | | | Each year, compensation decisions covering base salary, annual incentives and stock-based awardslong-term incentive award values are primarily driven by assessments of individual and Company performance. Comparisons are also made to the compensation survey data. Individual annual and long-term incentive payments from preceding years are not a significant factor in determining recommendations for the total compensation opportunity for an upcoming year. | | | | | | Compensation for the CEO is established using the same process and philosophy previously discussed for the other executive officers. The Compensation Committee establishes the CEO’s base salary, target annual incentive and stock-based awards using the executive compensation competitive review report prepared annually by the independent compensation consultant, as indicated above. In addition, the CEO’s compensation relative to the next two highest-compensated executives is evaluated. | | | | Weighting of Pay
Elements – Fixed
Versus “At Risk”
Compensation | | As noted more fully below and in other sections of this Proxy Statement, a significant portion of target total direct compensation (defined as base salary, target annual incentives and the target value of stock-based awards)long-term incentives) granted to our executive officers in Fiscal 20152017 is based on the attainment of annual and long-term financial objectives whichthat we believe drive shareholder value. The following chart illustrates the target pay mix for our NEOs in Fiscal 2015.2017. Approximately 80% of our CEO’s target total direct compensation and, on average, 66%about 70% of our other NEOs’ target total direct compensation was at riskvariable in the form of performance share units, stock options, restricted share unitsannual cash-based incentives and annuallong-term stock-based incentives. | | | | | | | | | 
| | | We believe that this pay mix, with about 70% of pay variable basedits emphasis on achievement of annual and long-term financial objectives, and commensurate improvement in share price,performance-based compensation, provides strong motivation to focus on attaining results that create shareholder value. | | | Compensation Elements | | | | Base salariesSalariesBase salaries are provided to our executive officers for performing their day-to-day responsibilities.
| | Competitive base salaries allow the Company to attract and retain executive talent. For Fiscal 2015,2017, the Company’s budget for US salary increases was 3.25%2.5%, including a merit budget of 2.5%2%, with a range of 0-5%0-4%, and an additional 0.75%0.5% for promotions and market adjustments. Base salary increases, if any, are effective July 1 of each year. The base salaries of our executive officers are based on a review of the competitive median marketplace for equivalent executive positions as previously discussed, assessment of the executive officer’s individual performance by the |
| | CEO (or in the case of the CEO, by the Compensation Committee)Executive Committee of the Board of Directors), the performance of the Company and / or relevant business unit, internal pay relationships among executive officers based on relative duties and responsibilities, the tenure of the executive officer in his / her role, and the Company’s annual salary increase budget. After taking into considerationSalary increases for the foregoing, the Compensation Committee determinedNEOs ranged from 0.9% to increase the NEOs’ salaries ranging from 2.9% to 5.4%4.0%. | | | | Annual incentivesIncentives | | Annual incentives are intended to motivate and reward senior executives for achieving short-term businessfinancial goals and strategic objectives that drive Company and business unit performance. Annual incentives are payable for the achievement of annual financial performance goals established by the Compensation Committee and for individual performance and contributions. The financial goals represent 75% of the targeted annual incentive, and strategic objectives represent 25% of the targeted annual incentive. Financial goals are based upon a strategic plan presented to and approved by the Board of Directors annually. At the end of the fiscal year, a payout factor is calculated using actual results against target. The range of payout of annual incentives is 50% of target for achievement of financial performance at the threshold level to 150% of target for achievement of financial performance at the outstanding level. There is no payout of the financial portion of the annual incentives if achievement of financial performance is below the threshold level.Financial goals are based upon a strategic plan presented to and approved by the Board of Directors annually. At the end of the performance cycle a A payout factor is calculated using actual results against the target for the financial measures. This results in a payout from 0 to 150% for financial objectives. A ratingrange from 0 to 150% is also established for performance on strategic objectives.
|
| | Following are the Fiscal 20152017 target annual incentives for the NEOs:Named Executive Officer | | | | | | | | | | Named Executive Officer | | Target Annual Incentive
as a % of Base Salary | | | | Mark J. Allin | | 120 | % | | | | John A. Kritzmacher | | 100 | % | | | | Gary Rinck | | 75 | % | | | | John W. Semel | | 85 | % | | | | Jeffrey L. Sugerman | | 75 | % | |
| | The target annual incentive percentages for Messrs. Allin, Kritzmacher and Sugerman were raised from 110% to 120%, 95% to 100%, and 70% to 75%, respectively, in Fiscal 2017, to align compensation with the external market, using variable-pay elements. | | | | | | | | Stephen M. Smith | | | 140 | % | Mark J. Allin | | | 95 | % | John A. Kritzmacher | | | 95 | % | Gary Rinck | | | 75 | % | Joseph S. Heider | | | 95 | % | John W. Semel | | | 75 | % | Steven J. Miron | | | 95 | % |
The target annual incentive percentage for Mr. Smith was raised from 130% in Fiscal 2014 to 140% in Fiscal 2015, to bring his targeted cash compensation more in line with our executive compensation philosophy, using performance-based annual incentives.
The Company uses a Performance Management Program that measures performance against financial goals, consistent with the operating plan, and approved by the Compensation Committee, as well as other quantitative and qualitative strategic objectives established at the beginning of the fiscal year. The Compensation Committee approves the strategic objectives of the CEO, evaluates his performance in light of those strategic objectives, and discusses its recommendation with the Board of Directors in executive session. The CEO evaluates the performance of the executive officers against assigned quantitative and qualitative strategic objectives, and presents his ratings to the Compensation Committee for its review and approval.
For the 75% of the annual incentive that is based on financial measures, corporate financial performance metrics are used for corporate NEOs, and a combination of corporate (weighted at 25%) and relevant business performance metrics (weighted at 75%) are used for business NEOs. For Fiscal 2015,2017, the corporate performance metrics were revenue and EPS, and normalized FCF weighted at 30%, 40% and 30%, respectively.equally weighted. Performance metrics for individual businesses were revenue and CTP, weighted at 40% and 60%, respectively.equally weighted. These performance metrics are relevantimportant and visible short-term measures of our corporate and business unit success and alignaligned with shareholder and executive interests. The higher weight on the profit metric(s) ensures an appropriate distribution of incentives paid vis-a-vis what is retained by the Company in pretax income. return. | | | | | | In Fiscal 2015,2017, in comparison to the corporate target goals set by the Compensation Committee for annual incentive purposes (see table below) revenue achievement was 96.7%99% of target and EPS achievement was 100.3% of target, and normalized FCF achievement was 95.8%106.8% of target, resulting in a payout of 84.4%116.7% of target for the corporate performance measures.| Financial Objective | Weight | 2015 Threshold Performance Level | 2015
Target
Amount | 2015
Outstanding Performance Level | 2015
Results | | Revenue ($000s) | 30% | 95% | $1,916,000 | 105% | $1,852,500 | | EPS | 40% | 90% | $3.35 | 110% | $3.36 | | Normalized FCF ($000s) | 30% | 90% | $292,000 | 110% | $279,698 |
| Note: | Financial results used for incentive payment purposes were adjusted to be on a constant currency basis using budgeted foreign exchange rates. Certain items and events may be excluded as permitted by the shareholder-approved 2009 Executive Annual Incentive Plan. These exclusions ensure that executives will not be unduly influenced in their decision-making because they would neither benefit nor be penalized as a result of certain unexpected and uncontrollable or strategic events that may positively or negatively affect the performance metrics in the short-term. For Fiscal 2015, the principal exclusions were a disputed income tax deposit paid to the German tax authorities and restructuring and reorganization charges. Free cash flow is defined by the Company as cash from operating activities less cash used for investing activities excluding acquisitions. |
| | | | | | | | | | | | | | | | | | Financial Objective | | Weight | | 2017
Threshold
Performance
Level | | 2017
Target
Amount | | 2017
Outstanding
Performance
Level | | 2017
Results | | | | | Revenue ($000s) | | 50% | | 97% | | $1,769,300 | | 103% | | $1,752,000 | | | | | EPS | | 50% | | 93% | | $2.95 | | 107% | | $3.15 | |
| | Note: | Financial results used for incentive payment purposes were adjusted to be on a constant currency basis using budgeted foreign exchange rates. Certain items and events may be excluded as permitted by the shareholder-approved 2014 Executive Annual Incentive Plan. These exclusions ensure that executives will not be unduly influenced in their decision-making because they would neither benefit nor be penalized as a result of certain unexpected and uncontrollable or strategic events that may positively or negatively affect the performance metrics in the short-term. For Fiscal 2017, the principal exclusions were dilution related to recent acquisitions and tax credits related to prior years. |
| Quantitative and qualitative strategic objectives for Fiscal 20152017 were set based on the following goals: | · | Execute Fiscal 2015 Financial Plan to achieve targeted performance |
| · | Integrate recent acquisitions to create a high-growth Talent Management Solutions business |
| · | Invest in adding more value digitally to Wiley’s book and journal content |
| · | Increase efficiency and simplify business processes to enable better decision-making, reduce long-term technology investment and foster innovation |
| · | Accelerate growth in emerging markets |
| · | Drive double-digit growth in Wiley’s content-enabled solutions business |
| · | Clearly and succinctly articulate a vision for Wiley’s future success as a business built on the integration of high quality curated content, innovative technology and valued services |
| ● | Beat our revenue goals.Improve the top line in Research and K&L |
| ● | Drive profitable growth in Solutions.Achieve scale and efficiency |
| ● | Reach best in class for cost and delivery.Improve competitiveness |
| ● | Deliver technology results. Implement the systems we need |
| ● | Build a high-performance organization.Develop a culture of winning |
| ● | Empower people to succeed.Enhance Executive Leadership Team effectiveness |
| | | | | An evaluation of each executive officer’s achievement of Fiscal 20152017 strategic objectives in the context of the goals set forth above, was made by the CEO and approved by the Compensation Committee. In the case of the CEO, this evaluation was made by the CompensationExecutive Committee. |
| | There were no specific weightings for each of the preceding goals, and achievement of the strategic objectives was based on the Compensation Committee’s qualitative assessment. The key strategic accomplishments of the NEOs during Fiscal 20152017 include: continuing to reorganizefinancial performance in line with guidance provided; significant progress in our digital evolution; the acquisition of Atypon; steady performance from Journal subscriptions; strong growth from Education Books, Author-Funded Access, Test Preparation & Certification, Corporate Learning, Online Program Management, Professional Assessment, and restructure Wiley’s businessesCourse Workflow/WileyPLUS; continued transition of leadership and shared service functionsinvestment in new and existing talent to enhance business performanceperformance; initiated work on a multi-year operational excellence initiative; continued work on our ERP implementation and provide resources for reinvestment in new business growth and technology initiatives; growth of 10% in adjusted EPS; a 4% improvement in revenue primarily from journals subscriptions, funded access and other journal revenue, Online Training, Assessment and Test Preparation, Online Program Management (Deltak), and34ourheadquarters office transformation. |
WileyPLUS, and the recent acquisition and integration of Profiles International and CrossKnowledge into our Talent Solutions business.
| | | Payout of the financial and strategic objectives portions of the annual incentives as a percentage of target, and total Fiscal 20152017 annual incentives paid to the NEOs as a percentage of target, are noted in the table below.| Named Executive Officer | | Payout of
Financial-Based
Incentive as a %
of Target | | Payout of
Strategic Objectives
Incentive as a %
of Target | | Total Annual
Incentive Payout
as a % of Target | | Stephen M. Smith | | | 84.4 | % | | | 100 | % | | | 88.3 | % | | Mark J. Allin | | | 63.8 | % | | | 105 | % | | | 74.1 | % | | John A. Kritzmacher | | | 84.4 | % | | | 150 | % | | | 100.8 | % | | Gary Rinck | | | 84.4 | % | | | 105 | % | | | 89.5 | % | | Joseph S. Heider | | | 62.1 | % | | | 100 | % | | | 71.6 | % | | John W. Semel | | | 84.4 | % | | | 125 | % | | | 94.6 | % |
|
| | | | | | | | | | | | | | | | | | | Named Executive Officer | | Payout of
Financial-Based
Incentive as a %
of Target | | Payout of Strategic
Objectives
Incentive as a %
of Target | | Total Annual
Incentive Payout
as a % of Target | | | | Mark J. Allin | | | 116.7 | % | | | 100 | % | | | 113 | % | | | | John A. Kritzmacher | | | 116.7 | % | | | 150 | % | | | 125 | % | | | | Gary Rinck | | | 116.7 | % | | | 90 | % | | | 110 | % | | | | John W. Semel | | | 116.7 | % | | | 90 | % | | | 110 | % | | | | Jeffrey L. Sugerman | | | 107.0 | % | | | 110 | % | | | 108 | % |
| | Long-Term Stock-Based
Incentives | Long-term incentives are intended to motivate and reward executive officers for achieving long-term (three-year) business objectives that drive Company performance. The long-term incentive compensation program for executive officers consists of annual grants of performance share units stock options and restricted share units, weighted at approximately 50%, 30%60% and 20%40% of long-term target value, respectively. As noted above, we eliminated the use of stock options beginning in Fiscal 2017, and shifted the weight to performance share units (previously weighted at 50%) and restricted share units (previously weighted at 20%). | | | | The Compensation Committee believes the new mix of equity provides an appropriate balance between risk and potential reward by tying realizable compensation directly to pre-established performance goals and future increases in stock price, provides alignment with shareholder interests, and serves as an effective retention tool for superior performers.executive talent. In administering the long-term incentive program, the Compensation Committee considers data from the executive compensation survey previously discussed, (which utilizes FASB Accounting Standards Codification (“ASC”) Topic 718 values for equity), and the recommendations of the CEO (with respect to the other executive officers), to establish the targeted equity awards (value and number of shares)long-term incentive award values for each executive officer.
| | ● | Performance share units are used to focus executive officers on the achievement of three-year corporate financial performance goals established by the Compensation Committee. The use of corporate performance measures aligns executive officers with the overall success of the Company and the strategic plan approved by the Board of Directors. At the end of the performance cycle, a payout factor is calculated based on actual results against threshold, target and outstanding performance levels, resulting in a payout from 0% to 150% of the targeted number of performance shares for cycle. There is no payout in shares if performance is below the threshold level. For the Fiscal 2013-15 performance cycle, stake-in-the-ground fiscal 2015 EPS and three-year cumulative FCF were the performance measures, weighted at 60% and 40%, respectively. These are the same performance measures and weights used for the Fiscal 2015-17 performance cycle. These performance measures are meaningful measures of our financial health, drivers of shareholder value, and the focus of the long-term investors the Company wishes to attract. |
For the Fiscal 2013-15 performance cycle, EPS achievement was below threshold at 81.4% of target, and FCF achievement was 100.8% of target, resulting in a payout of 41.7% of the targeted number of performance share units for cycle. There is no payout in shares if performance is below the threshold level. Performance share units vest 50% at the end of the performance cycle and 50% the following April 30th, except in limited circumstances involving performance shares for thiscompleted performance cycle.cycles upon executive retirement, death or permanent disability. For participants of the Executive Long-Term Incentive Plan, dividend equivalents are paid on earned shares over the additional vesting period following the end of the performance cycle.
35 Beginning with the Fiscal 2018 grants, earned performance share units will vest 100% following the end of the performance cycle, once financial achievement levels have been approved by the Compensation Committee. |
| Financial Objective | FY2013-15
Threshold
Performance
Level | FY2013-15
Target
Amount | FY2013-15 Outstanding Performance
Level | FY2013-15
Results | | | | | | | | EPS | 90% | $4.20 | 110% | $3.42 | | Normalized FCF ($000s) | 90% | $845,000 | 110% | $851,998 |
| Note: | Financial results used for long-term incentive payment purposes were adjusted to be on a constant currency basis using budgeted foreign exchange rates and for certain items and events as permitted by the shareholder-approved 2009 Key Employee Stock Plan. These exclusions ensure that executives will not be unduly influenced in their decision-making because they would neither benefit nor be penalized as a result of certain unexpected and uncontrollable or strategic events that may positively or negatively affect the performance metrics in the short-term. For the Fiscal 2013-15 cycle, the principal exclusions were a disputed income tax deposit paid to the German tax authorities and restructuring and reorganization charges. Free cash flow is defined by the Company as cash from operating activities less cash used for investing activities excluding acquisitions. |
FollowingFor the Fiscal 2015-17 performance cycle, fiscal 2017 EPS and three-year cumulative FCF were the performance measures, weighted at 60% and 40%, respectively. As noted previously, for the Fiscal 2017-19 performance cycle, cumulative EBITDA and cumulative FCF are the performance measures used, with a weight of 60% and 40%, respectively. These performance measures maintain focus on simple, critical, long-term value drivers.
|
| | For the Fiscal 2013-152015-17 performance cycle, EPS achievement was below threshold at 87.5% of target, and FCF achievement was also below threshold at 83.9% of target. As a result, there was no payout to the NEOs for this performance cycle. |
| | | | | | | | | | | | | | | | | | | | | Financial Objective | | Fiscal 2015-17
Threshold
Performance
Level | | Fiscal 2015-17
Target Amount | | Fiscal 2015-17
Outstanding
Performance
Level | | Fiscal 2015-17
Results | | | | | EPS | | 90% | | $4.09 | | | 110% | | | $3.58 | | | | | | Normalized FCF ($000s) | | 90% | | $930,000 | | | 110% | | | $780,300 | |
| Note: | Financial results used for long-term incentive payment purposes were adjusted to be on a constant currency basis using budgeted foreign exchange rates and for certain items and events as permitted by the shareholder-approved 2014 Key Employee Stock Plan. These exclusions ensure that executives will not be unduly influenced in their decision-making because they would neither benefit nor be penalized as a result of certain unexpected and uncontrollable or strategic events that may positively or negatively affect the performance metrics in the short-term. For the Fiscal 2015-17 cycle the principal exclusions were dilution from acquisitions; additional ERP development and headquarters renovation costs versus the original Plan; expenses and cash payments related to restructuring actions; additional retirement plan payments and tax payments. Free cash flow is defined by the Company as cash from operating activities less cash used for investing activities excluding acquisitions. |
| The following table shows the Fiscal 2015-17 target performance shares earned for the NEOs, as a percentage of target:noting that none were earned: |
| | Named Executive Officer | | Target Performance
Shares for the
Fiscal 2015-17
Cycle | | Earned
Performance
Shares for the
Fiscal 2015-17 Cycle | | Total Payout
as a % of Target | | | Mark J. Allin | | 4,000 | | 0 | | 0% | | | John A. Kritzmacher | | 8,700 | | 0 | | 0% | | | Gary Rinck | | 4,200 | | 0 | | 0% | | | John W. Semel | | 2,000 | | 0 | | 0% | | | Jeffrey L. Sugerman | | 1,300 | | 0 | | 0% | | | | | | | | | | | |
| Named Executive Officer | | Target
Performance
Shares for the
FY2013-15 Cycle | | Earned
Performance
Shares for the
FY2013-15 Cycle | | Total Payout
as a % of Target | | | | | | | | | | Stephen M. Smith | | | 20,000 | | | | 8,340 | | | | 41.7 | % | | Mark J. Allin | | | 4,500 | | | | 1,877 | | | | 41.7 | % | | Gary Rinck | | | 6,000 | | | | 2,502 | | | | 41.7 | % | | Joseph S. Heider | | | 4,000 | | | | 1,668 | | | | 41.7 | % | | John W. Semel | | | 2,100 | | | | 876 | | | | 41.7 | % | | Steven J. Miron | | | 4,736 | | | | 1,975 | | | | 41.7 | % |
Mr. Kritzmacher is not included in the table above since he was not a participant for this performance cycle given his hire date.
| The NEOs’ target performance shares for the Fiscal 2015-172017-19 performance cycle are included in the Grants of Plan-Based Awards Table on page 40. Mr. Miron’s target42. |
| | ● | Restricted share units facilitate stock ownership, expediting achievement of the stock ownership multiple, and earnedprovide an additional retention mechanism. Dividend equivalents are paid on restricted share units until the shares for this performance cycle are prorated, reflecting his separation from servicevest. Restricted share units vest 25% per year, on NovemberApril 30 2014. | · | Stock optionsare used to align the interests of management with those of the Company’s shareholders. The Compensation Committee believes that because value is realized only if the Company’s stock price rises, that stock options are performance-based compensation.th. |
| · | Restricted share units, a regular part of the equity mix beginning with the Fiscal 2014 grants, will facilitate stock ownership, expediting achievement of the stock ownership multiple, and will provide an additional retention mechanism. Dividend equivalents are paid on restricted share units until the shares vest. |
Equity award grants
| | Stock-based awards are made using a ten-day trailing average stock price from the date five business days after the release of the Company’s year-end earnings. Equity | | | | One-Time Supplemental
Long-Term Incentives | | Periodically, one-time supplemental long-term incentives are used in situations where specific focus on a multi-year initiative is required. These performance-based awards vesthave specific, measurable objectives, and are typically paid on a continuum between a 50% after years fourthreshold performance level and five, excepta 150% outstanding performance level. There is sometimes a service-based component. | | | | | | In Fiscal 2016, Messrs. Kritzmacher and Sugerman were granted one-time supplemental long-term incentives, payable in limited circumstances involvingcash based on performance at the end of Fiscal 2017. Both awards also include a service component. Mr. Kritzmacher’s $500,000 long-term cash incentive was paid at the targeted level based on achievement of technology-related milestones, and tenure through the end of Fiscal 2017. Mr. Sugerman’s $900,000 long-term cash incentive was paid at 76.5% of target, or $688,800 based on the level of achievement of long-term revenue and CTP goals for the Talent Solutions and Education Services business, and tenure through the end of Fiscal 2017. Mr. Sugerman was granted a supplemental share-based award in Fiscal 2017 which was paid at 101.5% of target, or 2436 shares based on the achievement of Fiscal 2017 revenue and contribution to profit goals for completed performance cycles upon executive retirement, death or permanent disability.the Talent Solutions business. | | | | Stock Ownership Guidelines | | The Compensation Committee believes that the ultimate goal of the long-term incentive program is to align the interests of Company stockholders and management. To reinforce this principle, the Compensation Committee established stock ownership guidelines for all executive officers participating in the long-term incentive program. The ownership guideline for the CEO is six times base salary. The ownership guideline for the other executive officers is two and one-half times base salary. Shares counted toward the ownership guidelines consist of: |
| · | · | | | | | | | ● | Half of the performance share units earned (i.e.where the performance cycle has been completed), but not yet vested. (Assumes half will be surrendered to pay taxes.) |
| · | | | | | | | ● | Half of time-based restricted shares / restricted share units granted. (Assumes half will be surrendered to pay taxes.) |
| | | Mr. Rinck has exceeded his targeted shareholdings. | | | | |
| | Messrs. Smith, RinckAllin, Kritzmacher, Semel and Heider have exceeded their targeted shareholdings. Messrs. Kritzmacher and Allin areSugerman were relatively new to their roles in Fiscal 2017 and are makingmad progress toward meeting their ownership targets. For all equity grants awarded during and after June 2011, there is a stock retention requirement for our executive officers, including the NEOs, that requires retention of 50% of the net shares acquired upon the exercise of stock options or the vesting of performance share units and restricted shares/share units until the executive satisfies the stock ownership salary multiple. | | | | | Clawback Provision | | To ensure that our compensation program does not encourage excessive risk taking the Company has a clawback provision in both the annual and long-term incentive plans covering the top 450 employees in the Company. The clawback provision allows the Company to recoup incentive payments to covered incentive participants in the event that the Company restates its financial results because of fraud, gross negligence or intentional misconduct on the part of one or more employees and/or because of material non-compliance with securities laws. | | | | Hedging ProhibitedProhibition | | As part of an Insider Trading Policy, the Company strictly prohibits any type of hedging activity, including the use of financial instruments such as prepaid variable forwards, equity swaps, collars and/or exchange funds. | | | | | Retirement and Post-Employment Benefits | | All NEOs are eligible to participate in the Company’s qualified savings and retirement plans, as described further starting on page 44.46. However, because US and UK tax rules governing qualified retirement plans place significant limitations on the benefits that can be paid to executives, the Company has adopted four non-qualified deferred compensationretirement plans to supplement qualified retirement benefits.
| | ● | Nonqualified Supplemental Benefit Plan (the “Excess Plan”).The Excess Plan was adopted by the Board of Directors to restore benefits that cannot be provided under the Employees’ Retirement Plan of John Wiley & Sons, Inc. (“US Retirement Plan”) due to limitations imposed by the Internal Revenue Code. Participation in and accruals under the Excess Plan were frozen as of June 30, 2013. |
| · | | ● | Supplemental Executive Retirement Plan (the “SERP”).Participation in and accruals under the SERP were frozen as of June 30, 2013. The SERP is more fully described on page 45. |
| · | Deferred Compensation Plan(the “DCP”).The Deferred Compensation Plan was adopted by the Board of Directors to provide the opportunity to defer compensation for those executives who are not able to take full advantage of the Company’s qualified Savings Plan because of tax rules limiting contributions. In conjunction with the freeze of the US defined benefit plans, the Board approved amending the DCP to provide for Company contributions mirroring those made under the Savings Plan. | | | | |
| · | | | ● | Deferred Compensation Plan (the “DCP”).The Deferred Compensation Plan was adopted by the Board of Directors to provide the opportunity to defer compensation for those executives who are not able to take full advantage of the Company’s qualified Savings Plan because of tax rules limiting contributions. In conjunction with the freeze of the US defined benefit plans, the Board approved amending the DCP to provide for Company contributions mirroring those made under the Savings Plan. | | | | | | | ● | UK Unapproved Supplemental Plan (the “UK Non-Qualified Plan”).The UK Non-Qualified Plan was adopted by the Board of Directors to restore benefits for selected individuals that cannot be provided under the UK Qualified Plan due to limitations imposed by Her Majesty’s Revenue & Customs. Participation in and service-related accruals under the UK Non-Qualified Plan were frozen as of April 30, 2015. | | | | |
| As noted above, the Company ceased accruals and froze participation in the US defined benefit retirement plans, including the US Retirement Plan, the Excess Plan, and the SERP, effective June 30, 2013. At the same time, the Company enhanced its Defined Contribution Savings Plan (401(k)) and the DCP. Service-related accruals under the UK Qualified Plan and the UK Non-Qualified Plan were frozen as of April 30, 2015, and colleagues previously accruing benefits under the UK Qualified Plan became covered by the UK Group Personal Pension Plan (GPPP), a UK tax-qualified defined contribution arrangement. | Health and
Welfare Benefits | The Company provides or makes available a number of health and welfare benefits, such as medical, dental, vision, life, accident and long-term disability insurance to all US-based employees, including the NEOs. These benefits are competitive with those provided by other companies in the publishing / media and general industries andbenefits are provided primarily for the well-being of Wiley employees, and at the same time enhance Wiley’s attractiveness as an employer of choice. | | | Perquisites and
Other Benefits | The Company provides limited perquisites and other personal benefits to the NEOs, of which the incremental cost to the Company in the aggregate is generally in the range of $10,000 to $18,000$19,000 annually. These taxable benefits are provided primarily for the financial security and productivity of executives, which allows greater focus on Wiley business activities. These limited perquisites primarily consist of financial planning and tax preparation, an allowance for business and health club memberships, parking in the headquarters building (where appropriate). In During Fiscal 2012, we eliminated tax “gross-ups” for perquisites provided to our executive officers. Any taxes on perquisites are now paid by the executives.2017, Mr. Allin whose previous position had required spendingreceived a significant amounttaxable allowance of time$10,000 per month for relocation, dual living expenses and family travel, as his family remained in the UK. In addition, since Mr. Allin traveled extensively and has tax obligations in both the UK and US, had been allowed the useCompany provides tax consultation and preparation assistance from PricewaterhouseCoopers. During Fiscal 2017, these charges amounted to $66,103. During Fiscal 2017, Mr. Sugerman received a taxable allowance of a Company-leased apartment in the US. This accommodation was provided in lieu of hotel expenses while conducting Company business. The apartment was available to other Company employees throughout the year.$12,500 per month for relocation, dual housing and living expenses. | | | Post-Employment
Benefits | Depending on the circumstances of their termination, the NEOs are eligible to receive severance benefits in the form of base salary as a lump-sum payment, annual incentive, healthcare benefits and accelerated vesting of equity as determined by the provisions in their employment agreements or the Executive Severance Plan, which are discussed in detail starting on page 51.47. Under a dismissal without cause or constructive discharge following a change of control, the Company provides these severance benefits because it serves the best interest of the Company and its shareholders to have executives focus on the business merits of mergers and acquisitions without undue concern for their personal financial outcome. In the case of a without cause termination or constructive discharge absent a change in control, the Company believes it is appropriate to provide severance for a limited period to bridge executives to new employment, particularly in view of our non-compete agreements which require that for twelve months following termination the executive will not compete with the Company or solicit customers or employees.and non-solicitation covenants. As part of his separation from service, Mr. Miron received severance equal to twenty-four months’ base salary, payable in a lump-sum; benefits coverage for a two-year period; prorated incentive payment under the Fiscal 2015 annual incentive plan, based on actual financial performance; vesting of all earned but unvested performance shares; continued vesting of stock options and restricted share units for three years following his separation date; continued prorated participation in all active long-term performance cycles, with payment in shares following the end of the cycles; and financial planning and tax preparation services for six months.
|
| Tax Deductibility of Compensation | | Ordinarily it is in the best interest of the Company to retain flexibility in its compensation programs to enable it to appropriately reward, retain and attract executive talent necessary to further the Company’s success. To the extent such goals can be met with compensation that is designed to be deductible under Section 162(m) of the Internal Revenue Code of 1986, as amended (the “Code”), such as the 20092014 Key Employee Stock Plan and the Executive Annual Incentive Plan, each approved by the shareholders in September 2009, and the successor Plans, approved by shareholders in September 2014, such compensation plans will be used. However, the Compensation Committee recognizes that in appropriate circumstances, compensation that is not deductible under the Code may be paid at the Compensation Committee’s discretion. The rules and regulations promulgated under Code Section 162(m) are complex and subject to change from time to time, sometimes with retroactive effect. There can be no guarantee, therefore, that amounts potentially subject to the Code Section 162(m) limitations will be treated by the Internal Revenue Service as “qualified performance-based compensation” under Code Section 162(m) and/or deductible by the Company. Closing Statement The executive compensation program discussed herein is based on our beliefs that: ● The quality of our leadership is among the most important determinants of the Company’s success; ● Our ability to attract and retain industry leaders who will ensure our success requires a competitive, performance-based compensation program; ● Our shareholders are best served by providing our executive officers with appropriate financial rewards directly linked to the long-term success of the Company; and ● Our executive officers must share in the risks as well as the rewards of achieving the Company’s challenging performance goals. | | | | | · | The quality of our leadership is among the most important determinants of the Company’s success; |
| · | Our ability to attract and retain industry leaders who will ensure our success requires a competitive, performance-based compensation program; |
| · | Our shareholders are best served by providing our executive officers with appropriate financial rewards directly linked to the long-term success of the Company; and |
| · | Our executive officers must share in the risks as well as the rewards of achieving the Company’s challenging performance goals. |
We believe that the Company’s executive compensation program meets the goals and objectives discussed above. Summary Compensation Table:
Name
[a] | Year
[b] | Salary
($)
[c] | Bonus
($)
[d] | Stock
Awards
($)
[e] | Option
Awards
($)
[f] | Non-
Equity
Incentive
Plan
Compen-
sation
($)
[g] | Change in
Pension
Value
and
Nonqualified
Deferred
Compensation
Earnings
($)
[h] | All
Other
Compen-
sation
($)
[i] | SEC
Total
($)
[j] | | Stephen M. Smith | 2015 | 912,500 | | 1,492,500 | 640,900 | 1,137,304 | 498,877 | 164,882 | 4,846,963 | | | 2014 | 869,167 | | 1,403,315 | 607,800 | 1,434,956 | 714,201 | 138,721 | 5,168,159 | | | 2013 | 833,333 | | 961,200 | 1,229,000 | 752,724 | 1,441,655 | 132,083 | 5,349,996 | | Mark J. Allin | 2015 | 472,870 | | 334,320 | 167,620 | 309,836 | 332,866 | 140,450 | 1,757,962 | | | 2014 | 421,623 | | 320,193 | 132,703 | 388,137 | (106,894) | 95,232 | 1,250,994 | | | 2013 | 399,253 | | 216,270 | 320,769 | 310,748 | 651,647 | 226,671 | 2,125,359 | | John A. Kritzmacher | 2015 | 616,667 | | 728,340 | 311,100 | 593,712 | 1,312 | 78,447 | 2,329,577 | | | 2014 | 525,000 | | 913,425 | 607,800 | 667,710 | 100 | 36,150 | 2,750,185 | | Gary Rinck | 2015 | 531,667 | | 352,230 | 149,600 | 359,319 | 503,614 | 51,300 | 1,947,730 | | | 2014 | 512,500 | | 347,864 | 144,859 | 477,598 | 320,715 | 38,149 | 1,841,685 | | | 2013 | 497,500 | | 288,360 | 307,250 | 280,031 | 358,896 | 18,327 | 1,750,364 | | Joseph S. Heider | 2015 | 386,667 | | 286,560 | 122,400 | 265,255 | 393,203 | 56,090 | 1,510,174 | | John W. Semel | 2015 | 394,625 | | 167,160 | 71,400 | 281,204 | 38,682 | 36,040 | 989,111 | | Steven J. Miron | 2015 | 306,667 | | 417,900 | 178,500 | 236,380 | 544,129 | 1,114,297 | 2,797,873 | | | 2014 | 512,500 | | 383,441 | 160,054 | 528,329 | (194,949) | 32,535 | 1,421,910 | | | 2013 | 495,833 | | 264,330 | 337,975 | 352,183 | 778,754 | 25,376 | 2,254,451 |
| (c): | The 2013 base salary reported in this column for Mr. Allin has been converted to US dollars using the Fiscal 2013 average exchange rate of £1=US$1.5760. The 2014 base salary reported in this column for Mr. Allin has been converted to US dollars using the Fiscal 2014 average exchange rate of £1=US$1.6011. The 2015 base salary reported in this column for Mr. Allin has been converted to US dollars using the Fiscal 2015 average exchange rate of £1=US$1.5997. The 2014 base salary reported in this column for Mr. Kritzmacher reflects his period of employment during this fiscal year. |
| (e): | The amounts reported in this column consist of performance share units and, for fiscal years 2014 and 2015, restricted share units granted under the Company’s 2009 and 2014 Key Employee Stock Plans. The amounts noted for the performance share units represent the value at the grant date based on the probable outcome of the performance conditions under the awards. Maximum value payouts of the performance share units are 150% of target, and will only occur if the Company reaches preset “outstanding” performance benchmarks. To calculate the fair value of the awards, the market price on the date of grant is used in accordance with the FASB ASC Topic 718, Stock Compensation. Refer to Notes 2 and 18 in the Notes to the Consolidated Financial Statements in the Company’s 2015 Annual Report on Form 10-K for the assumptions used in determining FAS ASC Topic 718, Stock Compensation values.Summary
Compensation Table: | Name
[a] | | Year
[b] | | Salary
($)
[c] | | Bonus
($)
[d] | | Stock
Awards
($)
[e] | | Option
Awards
($)
[f] | | Non-Equity Incentive Plan Compensation
($)
[g] | | Change in Pension
Value and Nonqualified Deferred Compensation Earnings
($)
[h] | | All Other
Compensation
($)
[i] | | Total
($)
[j] | | | | Mark J. Allin | | 2017 | | 775,000 | | | | 1,919,512 | | 0 | | 1,053,234 | | 507,177 | | 270,023 | | 4,524,947 | | | | | | 2016 | | 737,500 | | | | 2,283,832 | | 498,845 | | 875,119 | | 108,462 | | 202,305 | | 4,706,063 | | | | | | 2015 | | 472,870 | | | | 334,320 | | 167,620 | | 309,836 | | 332,866 | | 140,450 | | 1,757,962 | | | | John A. Kritzmacher | | 2017 | | 662,500 | | | | 1,174,941 | | 0 | | 1,331,416 | | 7,498 | | 91,348 | | 3,267,703 | | | | | | 2016 | | 645,000 | | | | 745,787 | | 319,485 | | 701,326 | | 1,074 | | 79,970 | | 2,492,641 | | | | | | 2015 | | 616,667 | | | | 728,340 | | 311,100 | | 593,712 | | 1,312 | | 78,447 | | 2,329,577 | | | | Gary Rinck | | 2017 | | 549,167 | | | | 539,493 | | 0 | | 453,854 | | 462,771 | | 61,044 | | 2,066,328 | | | | | | 2016 | | 543,333 | | | | 352,737 | | 151,040 | | 423,363 | | 199,047 | | 54,549 | | 1,724,069 | | | | | | 2015 | | 531,667 | | | | 352,230 | | 149,600 | | 359,319 | | 503,614 | | 51,300 | | 1,947,730 | | | | John W. Semel | | 2017 | | 454,167 | | | | 479,776 | | 0 | | 425,522 | | 1,354 | | 37,872 | | 1,398,691 | | | | | | 2016 | | 450,000 | | | | 307,945 | | 132,013 | | 396,175 | | 24,522 | | 34,147 | | 1,344,802 | | | | | | 2015 | | 394,625 | | | | 167,160 | | 71,400 | | 281,204 | | 38,682 | | 36,040 | | 989,111 | | | | Jeffrey Sugerman | | 2017 | | 379,167 | | | | 383,854 | | 0 | | 995,941 | | 897 | | 179,351 | | 1,939,210 | | | | | | 2016 | | 375,000 | | | | 179,728 | | 76,995 | | 288,914 | | (1,839) | | 181,831 | | 1,100,629 | |
| (f): | The amounts reported in this column consist of stock options | | (e): The amounts reported in this column consist of performance share units and restricted share units granted under the Company’s 2009 and 2014 Key Employee Stock Plans. The amounts noted for the performance share units represent the value at the grant date based on the probable outcome of the performance conditions under the awards. Maximum value payouts of the performance share units are 150% of target, and will only occur if the Company reaches preset “outstanding” performance benchmarks. To calculate the fair value of the awards, the market price on the date of grant is used in accordance with the FASB ASC Topic 718, Stock Compensation. Refer to Notes 2 and 16 in the Notes to the Consolidated Financial Statements in the Company’s 2017 Annual Report on Form 10-K for the assumptions used in determining FAS ASC Topic 718, Stock Compensation values. (f): The amounts reported in this column consist of stock options granted under the Company’s 2014 Key Employee Stock Plans. Beginning in Fiscal 2017, the company has stopped awarding stock options. The assumptions used to calculate the stock option award values for Fiscal 2015 and 2016 are in accordance with FASB ASC Topic 718, Stock Compensation. Refer to Notes 2 and 18 in the Notes to the Consolidated Financial Statements in the Company’s 2015 and 2016 Annual Report on Form 10-K for the assumptions used in determining FASB ASC Topic 718, Stock Compensation values. The amounts listed do not necessarily reflect the level of compensation that may be realized by our named executive officers. (g): The total annual incentive for Fiscal 2017 was earned based on the achievement of pre-established corporate and, in the case of Mr. Sugerman, business financial measures—including revenue, EPS and business CTP—approved by the Compensation Committee, as well as the achievement of strategic objectives that are designed to drive improved performance for the Company. Mr. Kritzmacher and Mr. Sugerman also received payment for their supplemental long-term cash incentives. Mr. Kritzmacher’s payment was based on achievement of an agreed set of technology-related milestones and continued service through the two-year period. Mr. Sugerman’s long-term cash incentive was payable based on achievement of long-term revenue and CTP goals for the Talent Solutions and Education Services business, and continued service through the two-year period. (h): The change in pension value is mostly attributable to the net effects of changing the discount rates, decrease in the discount period, revising the mortality table, and updating the UK exchange rates for UK pension benefits. Change in pension values for Messrs. Allin, Rinck, Semel and Sugerman are $506,110, $111,169, $1,133 and $768 respectively. Nonqualified deferred compensation earnings represents the market fluctuation on account balances based on the investment funds for Messrs. Allin, Kritzmacher, Rinck, Semel and Sugerman are $1,067, $7,498, $351,602, $221 and $129 respectively.
Mr. Allin’s Present Value of Accumulated Benefits from the UK Qualified Plan was calculated using a British £ to US $ conversion factor of 1.4542 and 1.28086, for benefits as of April 30, 2016 and April 30, 2017, respectively. Mr. Allin’s Present Value of Accumulated Benefits from the UK Qualified Plan was calculated using UK disclosure assumptions as of April 30, 2016 and April 30, 2017, as applicable. The change in pension value reflects the US Qualified, Excess and SERP benefits frozen as of June 30, 2013. Note the following: ● Mr. Allin continued to accrue UK pension benefits through April 30, 2015. ● Additional US pension accruals ceased as of the US plans’ freeze. ● The change in pension value is mostly attributable to the net effects of changing the discount rates, decrease in the discount period, revising the mortality table, and updating the UK exchange rates for UK pension benefits. (i): All Other Compensation consists of the following in Fiscal 2017: ● Employer contributions to the Company 401(k) plan and Deferred Compensation Plan for Messrs. Allin, Kritzmacher, Rinck, Semel and Sugerman, are valued at $71,330, $58,878, $42,697, $37,415 and $29,352 respectively. ● Perquisites (financial planning, health club membership fees, parking benefits) for Messrs. Allin, Kritzmacher and Rinck, valued at $12,590, $18,470 and $18,347, respectively. ● Mr. Allin was a UK-based executive who traveled extensively to the US on Company business, and relocated to the US in June 2015. He has tax obligations and other filing requirements in both the UK and the US. The Company has agreed to cover tax preparation and filing assistance in the UK and the US, and completion of other filing obligations in the UK and the US for Mr. Allin through PricewaterhouseCoopers (PwC), amounting to $66,103 in Fiscal 2017, and included as “other compensation.” ● The Compensation Committee agreed to provide Mr. Allin with an allowance of $10,000 per month to be reviewed annually and used to cover dual UK and US living expenses, and personal travel for himself and his family between the UK and the US, since part of his family continues to reside in the UK. ● The Compensation Committee agreed to provide Mr. Sugerman with an allowance of $12,500 per month to cover relocation, dual housing and living expenses. ● The following NEO’s requested and received a cash donation from the Company to organizations pursuant to the Company’s Matching Gift Program: Mr. Kritzmacher - $14,000 and Mr. Semel - $460. |
| | | | | | | | | | | | | | | | | | | | | | | | | | Grants of Plan-Based
Awards During
Fiscal 2017: | | | | | | | | | | | | | | | | | All Other
Stock
Awards:
Number of
Shares of
Stock or
Units
(#)
[i] | | All Other Option
Awards: Number of Securities Underlying Options
(#)
[j] | | Exercise or Base Price of Option Awards
($/Sh)
[k] | | Grant Date Fair Value of Stock and Option Awards
($)
[l] | | | | | | | | | | | | | | | | | | | | | | | | | | |
Estimated Possible Payouts
Under Non-Equity Incentive
Plan Awards | | Estimated Future Payouts
Under Equity Incentive
Plan Awards | | | | | | | | | Threshold ($)
[c] | | Target
($)
[d] | | Maximum
($)
[e] | | Threshold
(#)
[f] | | Target
(#)
[g] | | Maximum
(#)
[h] | | | | | | | Mark J. Allin | | 6/22/2016 | | 468,000 | | 936,000 | | 1,404,000 | | | | | | | | | | | | | | | | | | | | | 6/22/2016 | | | | | | | | 11,283 | | 22,565 | | | 33,848 | | | | | | | | 1,151,718 | | | | | | 6/22/2016 | | | | | | | | | | | | | | | 15,043 | | | | | | 767,795 | | | | John A. Kritzmacher | | 6/22/2016 | | 332,500 | | 665,000 | | 997,500 | | | | | | | | | | | | | | | | | | | | | 6/22/2016 | | | | | | | | 6,905 | | 13,810 | | | 20,715 | | | | | | | | 704,862 | | | | | | 6/22/2016 | | | | | | | | | | | | | | | 9,210 | | | | | | 470,078 | | | | Gary Rinck | | 6/22/2016 | | 206,250 | | 412,500 | | 618,750 | | | | | | | | | | | | | | | | | | | | | 6/22/2016 | | | | | | | | 3,170 | | 6,340 | | | 9,510 | | | | | | | | 323,594 | | | | | | 6/22/2016 | | | | | | | | | | | | | | | 4,230 | | | | | | 215,899 | | | | John W. Semel | | 6/22/2016 | | 193,375 | | 386,750 | | 580,125 | | | | | | | | | | | | | | | | | | | | | 6/22/2016 | | | | | | | | 2,820 | | 5,640 | | | 8,460 | | | | | | | | 287,866 | | | | | | 6/22/2016 | | | | | | | | | | | | | | | 3,760 | | | | | | 191,910 | | | | Jeffrey L. Sugerman | | 6/22/2016 | | 142,500 | | 285,000 | | 427,500 | | | | | | | | | | | | | | | | | | | | | 6/22/2016 | | | | | | | | 1,565 | | 3,130 | | | 4,695 | | | | | | | | 159,755 | | | | | | 6/22/2016 | | | | | | | | | | | | | | | 2,080 | | | | | | 106,163 | | | | | | 9/21/2016 | | | | | | | | 1,200 | | 2,400 | | | 3,600 | | | | | | | | 117,936 | |
| (g): | The total annual incentive for Fiscal 2015 was earned based on the achievement of pre-established corporate and, in the case of Messrs. Allin, Heider and Miron, business financial measures—including revenue, profit and cash flow—approved by the Compensation Committee, as well as the achievement of strategic objectives that are designed to drive improved performance for the Company in the current and future fiscal years.Mr. Miron’s total annual incentive for Fiscal 2015 is prorated, reflecting his separation from service on November 30, 2014. |
| (h): | Messrs. Smith and Allin’s Present Value of Accumulated Benefits from the UK Qualified and UK Non-Qualified Plans were calculated using a British £ to US $ conversion factor of 1.6811 and 1.5181, for benefits as of April 30, 2014 and April 30, 2015, respectively. Messrs. Smith and Allin’s Present Value of Accumulated Benefits from the UK Qualified and UK Non-Qualified Plans were calculated using UK disclosure assumptions as of April 30, 2014 and April 30, 2015, as applicable. The change in pension value reflects the US Qualified, Excess and SERP benefits frozen as of June 30, 2013. Note the following: |
| · | Mr. Allin continued to accrue UK pension benefits through April 30, 2015. |
| · | Additional US pension accruals ceased as of the US plans' freeze. |
| · | The change in pension value is mostly attributable to the net effects of changing the discount rates, decrease in the discount period, revising the mortality table, updating the UK exchange rates for UK pension benefits, the growth in included earnings (note the exception for Mr. Allin, as described below). |
| (i): | All Other Compensation consists of the following in Fiscal 2015: |
| · | Employer contributions to the Company 401(k) plan and Deferred Compensation Plan for Messrs. Smith, Kritzmacher, Rinck, Heider, Semel and Miron, are valued at $109,669, $61,047, $47,400, $38,690, $36,040 and $40,797 respectively. |
| · | Perquisites (financial planning, health club membership fees, parking benefits) for Messrs. Smith, Allin, Kritzmacher, Rinck, Heider and Miron, valued at $12,000, $12,000, $17,4000, $3,900, $17,400 and $13,500, respectively. |
| · | The Compensation Committee agreed to provide Mr. Smith with an allowance to be reviewed annually and used to cover personal travel for himself and his family between the UK and the US, since part of his family resides in the UK. In Fiscal 2015, these travel expenses amounted to $65,000. |
| · | Mr. Smith continues to have tax obligations in the UK, and the Company has agreed to cover personal tax preparation and filing, and completion of other filing obligations in the UK and the US, amounting to $43,213 in Fiscal 2015, and included as “other compensation.” |
| · | Mr. Allin was a UK-based executive who traveled extensively to the US, and has tax obligations in both the UK and the US. The Company has agreed to cover tax preparation and filing assistance in the UK and the US, and completion of other filing obligations in the UK and the US for Mr. Allin through PricewaterhouseCoopers (PwC), amounting to $55,252 in Fiscal 2015, and included as “other compensation.” |
| · | Mr. Allin, while based in the UK, had received an annual car allowance equal to £8,250 per annum. That amount has been converted to $13,209 using the Fiscal 2015 average exchange rate of £1=US$1.5997. |
| · | The Compensation Committee agreed to provide Mr. Allin with an allowance of $20,000 per month to be reviewed annually and used to cover dual UK and US living expenses, and personal travel for himself and his family between the UK and the US, since part of his family continues to reside in the UK. |
| · | Severance for Mr. Miron of $1,060,000, equivalent to two years of his base salary at termination of $530,000, consistent with his employment agreement. |
Grants of Plan-Based Awards Table:
Name [a] | Grant Date [b] | Estimated Possible Payouts Under
Non-Equity Incentive Plan Awards | Estimated Future Payouts Under
Equity Incentive Plan Awards | All Other Stock Awards: Number of Shares of Stock or Units (#) [i] | All Other Option Awards: Number of Securities Underlying Options (#) [j] | Exercise or Base Price of Option Awards ($/Sh) [k] | Grant Date Fair Value of Stock and Option Awards ($) [l] | Threshold ($) [c] | Target ($) [d] | Maximum ($) [e] | Threshold (#) [f] | Target (#) [g] | Maximum (#) [h] | | Stephen M. Smith | 6/18/14 | 644,000 | 1,288,000 | 1,932,000 | | | | | | | | | | 6/24/14 | | | | 8,950 | 17,900 | 26,850 | | | 59.70 | 1,068,630 | | | 6/24/14 | | | | | | | 7,100 | | 59.70 | 423,870 | | | 6/24/14 | | | | | | | | 37,700 | 59.70 | 640,900 | | Mark J. Allin | 6/18/14 | 208,961 | 417,922 | 626,882 | | | | | | | | | | 6/24/14 | | | | 2,000 | 4,000 | 6,000 | | | 59.70 | 238,800 | | | 6/24/14 | | | | | | | 1,600 | | 59.70 | 95,520 | | | 6/24/14 | | | | | | | | 9,860 | 59.70 | 167,620 | | John A. Kritzmacher | 6/18/14 | 294,500 | 589,000 | 883,500 | | | | | | | | | | 6/24/14 | | | | 4,350 | 8,700 | 13,050 | | | 59.70 | 519,390 | | | 6/24/14 | | | | | | | 3,500 | | 59.70 | 208,950 | | | 6/24/14 | | | | | | | | 18,300 | 59.70 | 311,100 | | | | | | | | | | | | | |
Name [a] | Grant Date [b] | Estimated Possible Payouts Under
Non-Equity Incentive Plan Awards | Estimated Future Payouts Under
Equity Incentive Plan Awards | All Other Stock Awards: Number of Shares of Stock or Units (#) [i] | All Other Option Awards: Number of Securities Underlying Options (#) [j] | Exercise or Base Price of Option Awards ($/Sh) [k] | Grant Date Fair Value of Stock and Option Awards ($) [l] | Threshold ($) [c] | Target ($) [d] | Maximum ($) [e] | Threshold (#) [f] | Target (#) [g] | Maximum (#) [h] | | Gary Rinck | 6/18/14 | 200,625 | 401,250 | 601,875 | | | | | | | | | | 6/24/14 | | | | 2,100 | 4,200 | 6,300 | | | 59.70 | 250,740 | | | 6/24/14 | | | | | | | 1,700 | | 59.70 | 101,490 | | | 6/24/14 | | | | | | | | 8,800 | 59.70 | 149,600 | | Joseph S. Heider | 6/18/14 | 185,250 | 370,500 | 555,750 | | | | | | | | | | 6/24/14 | | | | 1,700 | 3,400 | 5,100 | | | 59.70 | 202,980 | | | 6/24/14 | | | | | | | 1,400 | | 59.70 | 83,580 | | | 6/24/14 | | | | | | | | 7,200 | 59.70 | 122,400 | | John W. Semel | 6/18/14 | 148,707 | 297,413 | 446,120 | | | | | | | | | | 6/24/14 | | | | 1,000 | 2,000 | 3,000 | | | 59.70 | 119,400 | | | 6/24/14 | | | | | | | 800 | | 59.70 | 47,760 | | | 6/24/14 | | | | | | | | 4,200 | 59.70 | 71,400 | | Steven J. Miron | 6/18/14 | 251,750 | 503,500 | 755,250 | | | | | | | | | | 6/24/14 | | | | 2,500 | 5,000 | 7,500 | | | 59.70 | 298,500 | | | 6/24/14 | | | | | | | 2,000 | | 59.70 | 119,400 | | | 6/24/14 | | | | | | | | 10,500 | 59.70 | 178,500 |
(c) to (e):Represents the annual incentives for Fiscal 20152017 that are based on achievement of financial goals and strategic objectives. FinancialFor the annual incentives, financial performance measures and relative weighting of each performance measure, as well as the threshold, target and outstanding levels of performance, are set at the beginning of the fiscal year. Revenue, profitEPS and cash flowbusiness CTP were the financial performance measures used for Fiscal 2015.2017. Strategic objectives are designed to drive improved performance for the Company in the current and future fiscal years. Actual annual incentive payouts for Fiscal 20152017 are indicated in column (g) of the Summary Compensation Table. Mr. Miron’s Fiscal 2015 target incentive was subsequently prorated to $293,708, reflecting his November 30, 2014 separation from service. (f) to (h):Represents the performance share unit awards granted for the Fiscal 2015-172017-19 performance cycle pursuant to the 20092014 Key Employee Stock Plan. In Fiscal 20152017 executives received approximately 50%60% of their targeted long-term incentive (excluding one-time awards) in the form of performance share units. Financial performance measures and relative weighting of each performance measure, as well as the threshold, target and outstanding levels of performance are set at the beginning of the three-year plan cycle. Earnings per shareCumulative EBITDA and cumulative free cash flow are the performance measures used for the FY2015-17Fiscal 2017-19 performance cycle, weighted at 60% and 40%, respectively. No long-term incentive is payable unless the threshold performance level is reached for one of the performance measures. The performance share units, if earned, vest 50% on AprilJune 30, 20182019 and the remaining 50% on April 30, 2019.2020. Dividends are not paid during the performance period, but dividend equivalents are paid on earned shares following the performance cycle and before vesting. In the case of Mr. Sugerman, a supplemental performance award was granted and was paid out in June 2017 based on achievement of annual revenue and contribution to profit goals for the Solutions business. | (i): | Restricted share unit awards are granted on an annual basis, pursuant to the 2009 Key Employee Stock Plan. Shares vest 50% on April 30 the fourth year after grant and 50% on April 30 the fifth year after grant. In Fiscal 2015 executives received approximately 20%(i): Represents the restricted share unit awards granted for Fiscal 2017, pursuant to the 2014 Key Employee Stock Plan. Restricted share units vest 25% per year over four years, on April 30. In Fiscal 2017 executives received 40% of their targeted long-term incentive (excluding one-time awards) in the form of restricted share units. Dividend equivalents are paid on restricted share units until the shares vest. (j): Option grants are no longer awarded. (l): The grant date fair value of the performance share units and restricted share units is computed in accordance with FASB ASC Topic 718, Stock Compensation. The grant date fair value of the performance share unit and restricted share unit awards is based on a $51.04stock price. The fair value disclosed in this column for the performance share units represents the total fair value of those awards at the target level. Maximum value payouts are 150% of target, and will only occur if the Company reaches preset “outstanding” performance benchmarks. Refer to Notes 2 and 16 in the Notes to the Consolidated Financial Statements in the Company’s 2017 Annual Report on Form 10-K for the assumptions made in determining FASB ASC Topic 718, Stock Compensation values. |
| (j): | Option grants are awarded on an annual basis, pursuant to the 2009 Key Employee Stock Plan. Options have terms of ten years and vest 50% on April 30 the fourth year after grant and 50% on April 30 the fifth year after grant. All employees’ stock options have exercise prices that are equal to the grant date closing market price of Class A Stock. In Fiscal 2015 executives received approximately 30% of their targeted long-term incentive in the form of stock options. |
| (k): | The closing stock price on June 24, 2014. The exercise price of all stock options may not be less than 100% of the fair market value of the stock on the date of grant. |
| (l): | The grant date fair value of the performance share units and stock options is computed in accordance with FASB ASC Topic 718, Stock Compensation. The grant date fair value of the performance share unit and restricted share unit awards is based on a $59.70 stock price. The fair value disclosed in this column for the performance share units represents the total fair value of those awards at the target level. Maximum value payouts are 150% of target, and will only occur if the Company reaches preset “outstanding” performance benchmarks. The grant date fair value of stock option awards is based on a $17.00 Black-Scholes value. Refer to Notes 2 and 18 in the Notes to the Consolidated Financial Statements in the Company’s 2015 Annual Report on Form 10-K for the assumptions made in determining FASB ASC Topic 718, Stock Compensation values. |
41Outstanding Equity
Awards at Fiscal 2017
Year End: | Name
[a] | | Number of
Securities
Underlying
Unexercised
Options
(#)
Exercisable
[b] | | Number of
Securities
Underlying
Unexercised
Options
(#)
Unexercisable
[c] | | Equity
Incentive
Plan
Awards:
Number of
Securities
Underlying
Unexercised
Unearned
Options
(#)
[d] | | Option
Exercise
Price
($)
[e] | | Option
Expiration
Date
[f] | | Number of
Shares or
Units of
Stock That
Have Not
Vested
(#)
[g] | | Market
Value
of Shares
or Units
of Stock
That
Have Not
Vested
($)
[h] | | Equity
Incentive
Plan
Awards:
Number of
Unearned
Shares,
Units or
Other
Rights That
Have Not
Vested
(#)
[i] | | Equity
Incentive
Plan
Awards:
Market or
Payout
Value
of
Unearned
Shares,
Units
or Other
Rights
That Have
Not Vested
($)
[j] | | | Mark J. Allin | | 4,500 | | | | | | | $47.55 | | 6/25/2018 | | 3,100 | (1) | 163,370 | | 24,850 | (6) | 1,309,595 | | | | | 7,495 | | | | | | | $35.04 | | 6/24/2019 | | 1,150 | (1) | 60,605 | | 22,565 | (7) | 1,189,176 | | | | | 28,675 | | | | | | | $40.02 | | 6/23/2020 | | 1,600 | (2) | 84,320 | | | | | | | | | 26,100 | | | | | | | $49.55 | | 6/22/2021 | | 7,500 | (4) | 395,250 | | | | | | | | | 26,100 | | | | | | | $48.06 | | 6/26/2022 | | 2,970 | (3) | 156,519 | | | | | | | | | 7,598 | | 7,598 | (1) | | | | $39.53 | | 6/24/2023 | | 11,283 | (5) | 594,614 | | | | | | | | | | | 9,860 | (2) | | | | $59.70 | | 6/23/2024 | | | | | | | | | | | | | 16,910 | | 16,910 | (3) | | | | $55.99 | | 6/23/2025 | | | | | | | | | | | John A. Kritzmacher | | 30,000 | | 30,000 | (1) | | | | $39.53 | | 6/24/2023 | | 5,345 | (1) | 281,682 | | 9,510 | (6) | 501,177 | | | | | | | 18,300 | (2) | | | | $59.70 | | 6/23/2024 | | 3,500 | (2) | 184,450 | | 13,810 | (7) | 727,787 | | | | | 10,830 | | 10,830 | (3) | | | | $55.99 | | 6/23/2025 | | 1,905 | (3) | 100,394 | | | | | | | | | | | | | | | | | | | | 6,908 | (5) | 364,052 | | | | | | | Gary Rinck | | 30,000 | | | | | | | $47.55 | | 6/25/2018 | | 3,368 | (1) | 177,494 | | 4,500 | (6) | 237,150 | | | | | 30,000 | | | | | | | $35.04 | | 6/24/2019 | | 1,250 | (1) | 65,875 | | 6,340 | (7) | 334,118 | | | | | 25,000 | | | | | | | $40.02 | | 6/23/2020 | | 1,700 | (2) | 89,590 | | | | | | | | | 25,000 | | | | | | | $49.55 | | 6/22/2021 | | 900 | (3) | 47,430 | | | | | | | | | 25,000 | | | | | | | $48.06 | | 6/26/2022 | | 3,173 | (5) | 167,217 | | | | | | | | | 7,150 | | 7,150 | (1) | | | | $39.53 | | 6/24/2023 | | | | | | | | | | | | | | | 8,800 | (2) | | | | $59.70 | | 6/23/2024 | | | | | | | | | | | | | 5,120 | | 5,120 | (3) | | | | $55.99 | | 6/23/2025 | | | | | | | | | | | John W. Semel | | 4,100 | | | | | | | 48.06 | | 6/26/2022 | | 1,337 | (1) | 70,460 | | 3,930 | (6) | 207,111 | | | | | 2,850 | | 2,850 | (1) | | | | 39.53 | | 6/24/2023 | | 500 | (1) | 26.350 | | 5,640 | (7) | 297,228 | | | | | | | 4,200 | (2) | | | | 59.70 | | 6/23/2024 | | 800 | (2) | 42,160 | | | | | | | | | 4,475 | | 4,475 | (3) | | | | 55.99 | | 6/23/2025 | | 785 | (3) | 41,370 | | | | | | | | | | | | | | | | | | | | 2,820 | (5) | 148,614 | | | | | | | | | | | | | | | | | | | | | | | | | | | | | Jeffrey L. Sugerman | | 2,200 | | 2,200 | (1) | | | | $39.53 | | 6/24/2023 | | 1,016 | (1) | 53,543 | | 2,290 | (6) | 120,683 | | | | | | | 2,700 | (2) | | | | $59.70 | | 6/23/2024 | | 400 | (1) | 21,080 | | 3,130 | (7) | 164,951 | | | | | 2,610 | | 2,610 | (3) | | | | $55.99 | | 6/23/2025 | | 1,334 | (8) | 70,302 | | | | | | | | | | | | | | | | | | | | 500 | (2) | 26,350 | | | | | | | | | | | | | | | | | | | | 460 | (3) | 24,240 | | | | | | | | | | | | | | | | | | | | 1,560 | (5) | 82,212 | | | | | | | | | | | | | | | | | | | | 2,436 | (8) | 128,377 | | | | |
| | (1) Remaining 50% of award vests on April 30, 2018. Outstanding Equity Awards at(2) Award vests 50% on April 30, 2018 and 50% on April 30, 2019.
(3) Remaining 50% of award vests 25% on April 30, 2018 and 25% on April 30, 2019. (4) Remaining 75% of award vests 25% on June 1, 2017, 25% on June 1, 2018 and 25% on June 1, 2019. (5) Remaining 75% of award will vest 25% on April 30, 2018, 25% on April 30, 2019 and 25% on April 30, 2020. (6) Award vests 50% on June 30, 2018 and 50% on April 30, 2019. (7) Award vests 50% on June 30, 2019 and 50% on April 30, 2020. (8) Award vested 100% on June 30, 2017. (e): The exercise price of all stock options may not be less than 100% of the fair market value of the stock on the date of grant. (f): Stock options have a term of 10 years. Stock options continue to vest and can be exercised for a period following retirement, but no later than the expiration of the option. (g): Includes the second half of the shares earned for the Fiscal 2015 Year End:2014-16performance cycle; the restricted share units granted in June 2013-2016; and any supplemental awards , all of which will vest as noted above. | | | Option Awards | | Stock Awards | Name [a] | | | Number of Securities Underlying Unexercised Options (#) Exercisable [b] | | | | Number of Securities Underlying Unexercised Options (#) Unexercisable [c] | | | Equity Incentive Plan Awards: Number of Securities Underlying Unexercised Unearned Options (#) [d] | | Option Exercise Price ($) [e] | | Option Expiration Date [f] | | | Number of Shares or Units of Stock That Have Not Vested (#) [g] | | | | Market Value of Shares or Units of Stock That Have Not Vested ($) [h] | | | | Equity Incentive Plan Awards: Number of Unearned Shares, Units
or Other Rights
That Have
Not Vested (#) [i] | | | | Equity Incentive Plan Awards: Market
or Payout
Value of
Unearned Shares,
Units or Other
Rights That Have Not Vested ($) [j] | | | Stephen M. Smith | | | 28,675 | | | | | | | | | $48.46 | | 6/27/2017 | | | 4,770 | (1) | | | 271,318 | | | | 25,500 | (3) | | | 1,450,440 | | | | | | 28,675 | | | | | | | | | $47.55 | | 5/31/2018 | | | 20,000 | (5) | | | 1,137,600 | | | | 17,900 | (4) | | | 1,018,152 | | | | | | 70,000 | | | | | | | | | $35.04 | | 5/31/2018 | | | 8,340 | (2) | | | 474,379 | | | | | | | | | | | | | | 70,000 | | | | | | | | | $40.02 | | 5/31/2018 | | | 10,000 | (3) | | | 568,800 | | | | | | | | | | | | | | 50,000 | | | | | | | | | $49.55 | | 5/31/2018 | | | 7,100 | (4) | | | 403,848 | | | | | | | | | | | | | | | | | | 50,000 | (1) | | | | $49.55 | | 5/31/2018 | | | | | | | | | | | | | | | | | | | | | | | | | 100,000 | (2) | | | | $48.06 | | 5/31/2018 | | | | | | | | | | | | | | | | | | | | | | | | | 60,000 | (3) | | | | $39.53 | | 5/31/2018 | | | | | | | | | | | | | | | | | | | | | | | | | 37,700 | (7) | | | | $59.70 | | 7/29/2018 | | | | | | | | | | | | | | | | | | Mark Allin | | | 4,100 | | | | | | | | | $33.05 | | 6/21/2016 | | | 1,074 | (1) | | | 61,089 | | | | 5,800 | (3) | | | 329,904 | | | | | | 3,500 | | | | | | | | | $48.46 | | 6/27/2017 | | | 1,877 | (2) | | | 106,764 | | | | 4,000 | (4) | | | 227,520 | | | | | | 4,500 | | | | | | | | | $47.55 | | 6/25/2018 | | | 2,300 | (3) | | | 130,824 | | | | | | | | | | | | | | 7,495 | | | | | | | | | $35.04 | | 6/24/2019 | | | 1,600 | (4) | | | 91,008 | | | | | | | | | | | | | | 28,675 | | | | | | | | | $40.02 | | 6/23/2020 | | | | | | | | | | | | | | | | | | | | | 13,050 | | | | | | | | | $49.55 | | 6/22/2021 | | | | | | | | | | | | | | | | | | | | | | | | | 13,050 | (1) | | | | $49.55 | | 6/22/2021 | | | | | | | | | | | | | | | | | | | | | | | | | 26,100 | (2) | | | | $48.06 | | 6/26/2022 | | | | | | | | | | | | | | | | | | | | | | | | | 15,196 | (3) | | | | $39.53 | | 6/24/2023 | | | | | | | | | | | | | | | | | | | | | | | | | 9,860 | (4) | | | | $59.70 | | 6/23/2024 | | | | | | | | | | | | | | | | | | John A. Kritzmacher | | | | | | | 60,000 | (3) | | | | $39.53 | | 6/24/2023 | | | 12,500 | (6) | | | 711,000 | | | | 10,000 | (3) | | | 568,800 | | | | | | | | | | 18,300 | (4) | | | | $59.70 | | 6/23/2024 | | | 3,500 | (4) | | | 199,080 | | | | 8,700 | (4) | | | 494,856 | | | Gary Rinck | | | 30,000 | | | | | | | | | $47.55 | | 6/25/2018 | | | 1,431 | (1) | | | 81,395 | | | | 6,300 | (3) | | | 358,344 | | | | | | 30,000 | | | | | | | | | $35.04 | | 6/24/2019 | | | 2,502 | (2) | | | 142,314 | | | | 4,200 | (4) | | | 238,896 | | | | | | 25,000 | | | | | | | | | $40.02 | | 6/23/2020 | | | 2,500 | (3) | | | 142,200 | | | | | | | | | | | | | | 12,500 | | | | | | | | | $49.55 | | 6/22/2021 | | | 1,700 | (4) | | | 96,696 | | | | | | | | | | | | | | | | | | 12,500 | (1) | | | | $49.55 | | 6/22/2021 | | | | | | | | | | | | | | | | | | | | | | | | | 25,000 | (2) | | | | $48.06 | | 6/26/2022 | | | | | | | | | | | | | | | | | | | | | | | | | 14,300 | (3) | | | | $39.53 | | 6/24/2023 | | | | | | | | | | | | | | | | | | | | | | | | | 8,800 | (4) | | | | $59.70 | | 6/23/2024 | | | | | | | | | | | | | | | | | | Joseph S. Heider | | | 4,600 | | | | | | | | | $33.05 | | 6/21/2016 | | | 954 | (1) | | | 54,264 | | | | 4,800 | (3) | | | 273,024 | | | | | | 3,700 | | | | | | | | | $48.46 | | 6/27/2017 | | | 1,668 | (2) | | | 94,876 | | | | 3,400 | (4) | | | 193,392 | | | | | | 3,800 | | | | | | | | | $47.55 | | 6/25/2018 | | | 2,000 | (3) | | | 113,760 | | | | | | | | | | | | | | 5,800 | | | | | | | | | $35.04 | | 6/24/2019 | | | 1,400 | (4) | | | 79,632 | | | | | | | | | | | | | | 15,000 | | | | | | | | | $40.02 | | 6/23/2020 | | | | | | | | | | | | | | | | | | | | | 8,750 | | | | | | | | | $49.55 | | 6/22/2021 | | | | | | | | | | | | | | | | | | | | | | | | | 8,750 | (1) | | | | $49.55 | | 6/22/2021 | | | | | | | | | | | | | | | | | | | | | | | | | 17,500 | (2) | | | | $48.06 | | 6/26/2022 | | | | | | | | | | | | | | | | | | | | | | | | | 11,100 | (3) | | | | $39.53 | | 6/24/2023 | | | | | | | | | | | | | | | | | | | | | | | | | 7,200 | (4) | | | | $59.70 | | 6/23/2024 | | | | | | | | | | | | | | | | | | John W. Semel | | | 3,400 | | | | | | | | | $40.02 | | 6/23/2020 | | | 5,000 | (7) | | | 284,400 | | | | 2,500 | (3) | | | 142,200 | | | | | | 3,150 | | | | | | | | | $49.55 | | 6/22/2021 | | | 417 | (1) | | | 23,719 | | | | 2,000 | (4) | | | 113,760 | | | | | | | | | | 3,150 | (1) | | | | $49.55 | | 6/22/2021 | | | 876 | (2) | | | 49,827 | | | | | | | | | | | | | | | | | | 8,200 | (2) | | | | $48.06 | | 6/26/2022 | | | 1,000 | (3) | | | 56,880 | | | | | | | | | | | | | | | | | | 5,700 | (3) | | | | $39.53 | | 6/24/2023 | | | 800 | (4) | | | 45,504 | | | | | | | | | | | | | | | | | | 4,200 | (4) | | | | $59.70 | | 6/23/2024 | | | | | | | | | | | | | | | | | | Steven J. Miron | | | 12,500 | | | | | | | | | $40.02 | | 11/30/2017 | | | 1,975 | (8\) | | | 112,338 | | | | 3,642 | (8) | | | 207,157 | | | | | | 12,500 | | | | | | | | | $49.55 | | 11/30/2017 | | | 1,400 | (9) | | | 79,632 | | | | 972 | (11) | | | 55,287 | | | | | | | | | | 12,500 | (1) | | | | $49.55 | | 11/30/2017 | | | | | | | | | | | | | | | | | | | | | | | | | 27,500 | (2) | | | | $48.06 | | 11/30/2017 | | | | | | | | | | | | | | | | | | | | | | | | | 7,900 | (9) | | | | $39.53 | | 11/30/2017 | | | | | | | | | | | | | | | | |
| (1) | Remaining 50% of award vests on April 30, 2016. |
| (2) | Award vests 50% on April 30, 2016 and 50% on April 30, 2017. |
| (3) | Award vests 50% on April 30, 2017 and 50% on April 30, 2018. |
| (4) | Award vests 50% on April 30, 2018 and 50% on April 30, 2019. |
| (5) | Award vests 50% on June 23, 2015 and 50% on June 23, 2016. |
| (6) | Award vests 50% on June 17, 2015 and 50% on June 17, 2016. |
| (7) | Award vests 100% on September 18, 2016. |
| (8) | Award vests 100% on June 30, 2015. |
| (9) | Award vests 100% on April 30, 2017. |
| (10) | Award vests 100% on June 30, 2016. |
(11) | Award vests 100% on June 30, 2017. | | |
| (e): | The exercise price of all stock options may not be less than 100% of the fair market value of the stock on the date of grant. |
| (f): | Stock options have a term of 10 years. Stock options continue to vest and can be exercised for three years following retirement, but no later than the expiration of the option. |
| (g): | Includes the second half of the shares earned for the Fiscal 2012-14 long-term cycle; all shares earned for the Fiscal 2013-15 long-term incentive cycle; the restricted share units granted in June 2013 and June 2014; and any new hire or promotion restricted stock, all of which will vest as noted above. |
((h) and (j): h) and
(j):
Based on the April 30, 201528, 2017 closing market price of Class A stock of $56.88. | (i): | Represents the target number of performance share units granted but yet-to-be earned for the Fiscal 2014-16 and Fiscal 2015-17 long-term incentive cycles. The Fiscal 2014-16 shares, if earned, will vest half on April 30, 2017 and half on April 30, 2018. The Fiscal 2015-17 shares, if earned, will vest half on April 30, 2018 and half on April 30, 2019. |
Option Exercises and Stock Vested Table:$52.70.
| | Option Awards | Stock Awards | Name [a] | Number of Shares Acquired on Exercise (#) [b] | Value Realized on Exercise ($) [c] | Number of Shares Acquired On Vesting (#) [d] | Value Realized on Vesting ($) [e] | | Stephen M. Smith | 2,595 | $59,737 | 8,437 | $479,897 | | | 14,610 | $314,846 | 4,770 | $271,318 | | | 4,412 | $125,830 | | | | | 18,528 | $504,888 | | | | Mark J. Allin | 3,292 | $68,728 | 3,245 | $184,576 | | | 1,708 | $35,697 | 1,073 | $61,032 | | John A. Kritzmacher | — | — | — | — | | Gary Rinck | 15,000 | $180,600 | 3,894 | $221,491 | | | 15,000 | $188,100 | 1,431 | $81,395 | | Joseph S. Heider | — | — | 2,596 | $147,660 | | | | | 954 | $54,264 | | John W. Semel | 1,870 | $36,241 | 1,263 | $71,839 | | | 1,530 | $29,804 | 417 | $23,719 | | | 2,849 | $69,687 | | | | | 951 | $23,519 | | | | Steven J. Miron | 3,608 | $97,959 | 3,245 | $186,198 | | | 1,292 | $35,091 | 2,385 | $136,851 | | | 10,566 | $228,014 | | | | | 1,934 | $41,813 | | | | | 4,053 | $56,945 | | | | | 546 | $7,196 | | | | | 3,854 | $50,642 | | | | | 547 | $7,707 | | | | | 1,334 | $35,484 | | | | | 5,666 | $150,489 | | |
| (c): | The value realized on exercise represents the excess of the fair market value of the underlying securities purchased on the date of exercise over the exercise price contained in the option. |
| (d): | Vesting of the second half of the performance share units earned from the Fiscal 2011-13 Executive Long-Term Incentive Plan (Messrs. Smith, Allin, Rinck, Heider, and Miron ) and Business Officer Long-Term Incentive Plan (Mr. Semel), and the first half of the performance share units earned from the Fiscal 2012-14 Executive Long-Term Incentive Plan (Messrs. Smith, Allin, Rinck, Heider, and Miron ) and Business Officer Long-Term Incentive Plan (Mr. Semel), on April 30, 2015 for Messrs. Smith, Allin, Rinck, Heider and Semel, and December 15, 2014 for Mr. Miron given his separation from service on November 30, 2014. |
| (e): | The value realized on the vesting of restricted stock awards represents the value of stock no longer subject to a risk of forfeiture or other restrictions, obtained by multiplying the number of shares of stock released from such restrictions by the closing market price of Class A Common Stock on the dates of vesting. |
Pension Benefits Table:
Name [a] | Plan [b] | Number of Years Credited Service (#) [c] | Present Value of Accumulated Benefit (3) ($) [d] | Payments During Last Fiscal Year ($) [e] | | Stephen M. Smith | Qualified Plan | 11 | 405,061 | 0 | | | Excess Plan | 11 | 970,716 | 0 | | | SERP | 21 | 4,150,505 | 0 | | | UK Qualified Plan (1) (2) | 10 | 2,697,056 | 0 | | | UK Non-Qualified Benefit (1) (2) | 10 | 2,656,720 | 0 | | Mark J. Allin | Qualified Plan | N/A | N/A | 0 | | | Excess Plan | N/A | N/A | 0 | | | SERP | 13 | 1,138,477 | 0 | | | UK Qualified Plan (1) (2) | 15 | 1,182,752 | 0 | | | | | | |
Name [a] | Plan [b] | Number of Years Credited Service (#) [c] | Present Value of Accumulated Benefit (3) ($) [d] | Payments During Last Fiscal Year ($) [e] | | Gary Rinck | Qualified Plan | 9 | 317,362 | 0 | | | Excess Plan | 9 | 872,728 | 0 | | | SERP | 9 | 2,911,765 | 0 | | Joseph Heider | Qualified Plan | 20 | 460,289 | 0 | | | Excess Plan | 20 | 314,072 | 0 | | | SERP | 20 | 1,833,823 | 0 | | John Semel | Qualified Plan | 4 | 88,740 | 0 | | | Excess Plan | 4 | 112,227 | 0 | | Steven J. Miron | Qualified Plan | 20 | 375,095 | 0 | | | Excess Plan | 20 | 490,952 | 0 | | | SERP | 20 | 2,892,113 | 0 |
| | (i): Represents the target number of performance share units granted but yet-to-be earned for the Fiscal 2016-18 and Fiscal 2017-19 long-term incentive cycles. The Fiscal 2016-18 shares, if earned, will vest half on June 30, 2018 and half on April 30, 2019. The Fiscal 2017-19 shares, if earned, will vest half on June 30, 2019 and half on April 30, 2020. |
| | | | | | | | | | | | | | Option Exercises and | | | | Option Awards | | Stock Awards | | | Stock Vested Table: | | Name [a] | | Number of Shares
Acquired on
Exercise
(#) [b] | | Value Realized
on Exercise
($) [c] | | Number of Shares
Acquired on
Vesting
(#) [d] | | Value Realized
on Vesting
($) [e] | | | | | Mark J. Allin | | 3,500 | | | $11,580 | | | 12,934 | | | $684,672 | | | | | | John A. Kritzmacher | | 0 | | | $0 | | | 14,850 | | | $765,720 | | | | | | Gary Rinck | | 0 | | | $0 | | | 7,375 | | | $388,663 | | | | | | John W. Semel | | 7,250 | | | $60,454 | | | 8,607 | | | $434,189 | | | | | | Jeffrey L. Sugerman | | 0 | | | $0 | | | 2,165 | | | $114,096 | | |
| | (c): The value realized on exercise represents the excess of the fair market value of the underlying securities purchased on the date of exercise over the exercise price contained in the option. (d): Includes: ● the second half of the performance share units earned from the Fiscal 2013-15 performance cycle (Messrs. Allin, Kritzmacher, Rinck and Semel), ● the first half of the performance share units earned from the Fiscal 2014-16 performance cycles (Messrs. Allin, Kritzmacher, Rinck, Semel and Sugerman) ● the first half the restricted share units granted in June 2013 (Messrs Allin, Rinck, and Semel) ● the second quarter of restricted share units granted in June 2015 (Messrs. Allin, Kritzmacher, Rinck, Semel and Sugerman), ● the first quarter of restricted share units granted in June 2016 ● the first quarter of promotional restricted share award granted in June 2015 (Mr. Allin) ● the full vesting of a one-time restricted share award granted in September 2013 (Mr. Semel) (e): The value realized on the vesting of restricted stock awards represents the value of stock no longer subject to a risk of forfeiture or other restrictions, obtained by multiplying the number of shares of stock released from such restrictions by the closing market price of Class A Common Stock on the dates of vesting. |
| | | | | | | | | | | | | Pension Benefits Table: | | Name
[a] | | Plan
[b] | | Number of Years
Credited Service
(#)
[c] | | Present
Value of
Accumulated
Benefit(1)
($)
[d] | | Payments During
Last Fiscal Year
($)
[e] | | | | Mark J. Allin | | Qualified Plan | | N/A | | N/A | | 0 | | | | | | Excess Plan | | N/A | | N/A | | 0 | | | | | | SERP | | 13 | | 1,222,751 | | 0 | | | | | | UK Qualified Plan(2)(3) | | 16 | | 1,713,022 | | 0 | | | | Gary Rinck | | Qualified Plan | | 9 | | 356,413 | | 0 | | | | | | Excess Plan | | 9 | | 966,544 | | 0 | | | | | | SERP | | 9 | | 3,102,512 | | 0 | | | | John W. Semel | | Qualified Plan | | 4 | | 101,708 | | 0 | | | | | | Excess Plan | | 4 | | 124,879 | | 0 | | | | Jeffrey L. Sugerman | | Qualified Plan | | 0.5 | | 15,960 | | 0 | | | | | | Excess Plan | | 0.5 | | 29,913 | | 0 |
| | (1) The credited service and the accumulated benefits used to determine the present value of the US Qualified, Excess and SERP benefits are as of the US plans’ freeze on June 30, 2013. Mr. Allin’s UK plan credited service and accumulated benefit used to determine present value are as of April 30, 2017. (2) Mr. Allin’s Present Value of Accumulated Benefits from the UK Qualified Plan was calculated using a British £ to US $ conversion factor of 1.28086. (3) Mr. Allin’s Present Value of Accumulated Benefits from the UK Qualified Plan was calculated using UK disclosure assumptions including a 2.60% discount rate. (d): The amounts shown in the table above for all plans represent the actuarial present values of the executives’ accumulated benefits accrued as of April 30, 2017, calculated using the same assumptions in footnote 15 of the Company’s financial statements, except that the SERP benefit for Mr. Rinck calculated under the 1989 SERP has no mortality assumption and under the 1989 and 2005 SERP, no recognition of pre-retirement mortality. |
| (1) | Mark Allin and Stephen Smith’s Present Value of Accumulated Benefits from the UK Qualified and UK Non-Qualified Plans were calculated using a British £ to US $ conversion factor of 1.5181. |
| (2) | Mark Allin and Stephen Smith’s Present Value of Accumulated Benefits from the UK Qualified and UK Non-Qualified Plans were calculated using UK disclosure assumptions including a 3.60% discount rate. |
| (3) | The credited service and the accumulated benefits used to determine the present value of the US Qualified, Excess and SERP benefits are as of the US plans' freeze on June 30, 2013. Stephen Smith’s UK accumulated benefits used to determine present value are based on his UK plan credited service as shown. Mr. Allin's UK plan credited service and accumulated benefit used to determine present value are as of April 30, 2015. |
| (d) | The amounts shown in the table above for all plans represent the actuarial present values of the executives’ accumulated benefits accrued as of April 30, 2015, calculated using the same assumptions in footnote 17 of the Company’s financial statements, except that the SERP benefit for Mr. Rinck calculated under the 1989 SERP has no mortality assumption and under the 1989 and 2005 SERP, no recognition of pre-retirement mortality. |
A description of each plan follows.
The Employees
Retirement Plan of
John Wiley & Sons, Inc. (the
(the Qualified Plan) | The Company sponsors a qualified defined benefit pension plan to provide retirement benefits to US based employees of the Company. The Plan pays benefits at retirement to participants who terminate or retire from the Company after meeting certain eligibility requirements. Prior to January 1, 2005, benefits under the Qualified Plan provided for annual normal benefits payable at normal retirement age of 65 based on certain factors times average final compensation times years of service not to exceed 35 (the “Previous Benefit Formula”). Effective January 1, 2005 the Qualified Plan formula was revised to provide covered participants with enhanced future benefits. After January 1, 2005, benefits are calculated as the sum of: | ● | A frozen benefit as of December 31, 2004, calculated under the Previous Benefit Formula, plus |
| · | ● | An annual benefit earned for benefit service after January 1, 2005. The amount of each year’s accrual is the sum of: |
| · | ● | total annual compensation (annual base salary, plus 100% of bonus) for the year up to and including 80% of that year’s Social Security Wage Base times 1.0%, plus |
| · | ● | total annual compensation for the year in excess of 80% of that year’s Social Security Wage Base times 1.3%. |
In Fiscal 2013, the year in excess of 80% of that year’s Social Security Wage Base times 1.3%.
|
| The Company announced a cessation of accruals and freeze of participation in the US Qualified Retirement Plan, effective June 30, 2013. | | | | The plan recognizes a maximum of 35 years of benefit service, accruing through June 30, 2013. If the total benefit service is greater than 35 years at age 65, the benefit will be equal to the 35 consecutive years of benefit accruals that produce the highest combined amount. | | | | The plan provides for retirement as early as age 55 with ten years of service. The age 65 benefit is reduced by 4% per year for each year less than 65, unless a participant has 20 years of service, in which case the participant can retire as early as age 62 without an early retirement reduction. | | The frozen annual benefit calculated under the Previous Benefit Formula for the combined Qualified Plan and the Excess Plan described below for Messrs. Smith,Mr. Rinck Heider and Miron is $17,804, $3,399, $17,579, and $13,407, respectively.Messrs. Smith, Rinck and Heider are eligible for early retirement under this plan.
$3,399. | | | The Nonqualified
Supplemental Benefit
Plan (the Excess Plan) | The Excess Plan provides benefits that would otherwise be denied participants by reason of certain Code limitations on the tax-qualified benefit. In addition, the Excess Plan provides benefits to certain individuals which arise from additional service credit granted for previous employment with acquired companies. | | | | Average final compensation and total annual compensation are determined under the Excess Plan in the same manner as under the Qualified Plan, except that a participant’s compensation is not subject to the limitations under the Code. Years of service under the Qualified Plan and the Excess Plan are the number of years and months through the plans’ freeze date, June 30, 2013, limited to 35 years, worked for the Company and its subsidiaries after attaining age 21. In Fiscal 2013, the
| | | | The Company announced a cessation of accruals and freeze of participation in the US Supplemental Benefit (“Excess”) Plan, effective June 30, 2013. Messrs. Smith, Rinck and Heider are eligible for early retirement under this plan.
| | | Supplemental Executive
Retirement Plan (the SERP)
(the SERP)
| In March 2005, the Board froze participation in the existing 1989 SERP and adopted the 2005 SERP. All active participants in the 1989 SERP, except those who were directors, 5% owners or who were within two years of the normal retirement age of 65, were given the option, prior to December 31, 2005, to waive their right to all benefits under the 1989 SERP and receive benefits under the 2005 SERP in consideration of that waiver. Four participants elected to do so. Mr. Rinck remains in the 1989 SERP. | | | | The benefit under the 1989 SERP is the higher of the “primary” or the “additional” benefit. | | ● | The primary benefit consists of ten annual payments commencing at retirement (at or after age 65) determined by multiplying the participant’s base salary rate at retirement by 2.5, reducing the result by $50,000 and dividing the remainder by five. The plan also provides for an alternative early retirement benefit for participants who retire after age 55 with five years of service, a reduced payment for participants whose employment is terminated prior to age 65 other than on account of death (and who do not qualify for early retirement) and a survivor benefit for the beneficiaries of a participant who dies prior to age 65 while employed by the Company or an affiliate. |
| ·
| | ● | The additional benefit provides participants with a guaranteed total annual retirement benefit beginning at age 65 for ten years of 50%, 55%, or 65% (the “Applicable Percentage”) of average compensation, defined as base salary and annual incentive, over the executive’s highest three consecutive years. This amount is reduced by the retirement benefits under the Qualified Plan, the Excess Plan and the primary benefit above. The Applicable Percentage for Mr. Rinck is 50%. |
| The 2005 SERP provides a lifetime annual benefit determined by multiplying the executive’s average compensation over the highest three consecutive years times a service factor, which is the sum of years of service up to 20 years times 2%, plus years of service in excess of 20 times 1%, to a maximum of 35 years total. The 2005 SERP provides a reduced early retirement benefit for participants calculated in the same manner as the 1989 SERP. The participant may elect to receive his or her benefit in the form of a joint and survivor benefit on an actuarial equivalent basis. All other terms of the 2005 SERP are substantially the same as the 1989 SERP. In Fiscal 2013, the
| | | | The Company announced a cessation of accruals and freeze of participation in the US Supplemental Executive Retirement Plan, effective June 30, 2013. Messrs. Smith, Rinck and Heider are eligible for early retirement under this plan.
The John Wiley & Sons
Limited Retirement
Benefits Scheme (UK
Qualified Plan) | The Company sponsors an approved defined benefit scheme to provide benefits to UK based employees of the Company. The Scheme provides benefits at retirement to participants who terminate or retire from the Company after meeting certain eligibility requirements. Members have a right to take benefits at Normal Retirement Date (age 65), or earlier subject to conditions as have been notified to them. | | | | The basic rate of accrual under the Scheme is 1/60th of Final Pensionable Salary for each year and complete month of Pensionable Service. Different rates of accrual are provided for certain members as advised separately to them. | | | | Early retirement is possible, subject to Company/Scheme Trustees consent, from age 55. A reduction factor, unless otherwise agreed with the Scheme member concerned under separate notification, is applied for each year (and complete month) benefits are taken prior to Normal Retirement Date. Reduction factors are determined by the Scheme Trustees in conjunction with advice from the Scheme Actuary, and are subject to regular review. | | | | In Fiscal 2015, the Company announced its desire to cease of accruals based on service under the UK Qualified Plan. Following a period of consultation with Plan participants, service-related accruals under the Plan were frozen, effective April 30, 2015. |
|
Nonqualified Deferred
Compensation
(NQDC) Table: | Name
(a) | | Executive
Contributions
in Last FY
($)
(b) | | Registrant
Contributions
in Last FY
($)
(c) | | Aggregate
Earnings
in Last FY
($)
(d) | | Aggregate
Withdrawals/
Distributions
($)
(e) | | Aggregate
Balance
at Last FYE
($)
(f) | | | | Mark J. Allin | | 0 | | 61,880 | | 1,067 | | 0 | | 84,421 | | | | John A. Kritzmacher | | 0 | | 49,222 | | 7,498 | | 0 | | 151,169 | | | | Gary Rinck | | 248,307 | | 32,041 | | 351,602 | | 0 | | 3,239,450 | | | | John W. Semel | | 0 | | 26,265 | | 221 | | 0 | | 71,496 | | | | Jeffrey L. Sugerman | | 0 | | 18,064 | | 129 | | 0 | | 43,846 | |
The Unapproved Supplemental UK Plan (the UK Non-Qualified Plan)
This arrangement provides benefits, for individuals nominated by the Company, that otherwise be denied by Her Majesty’s Revenue & Customs due to benefit limitations under approved benefit schemes. For Mr. Smith the Plan originally provided benefits in the same manner as under the UK Qualified Plan for benefits in excess of the limits under the latter. However, for Mr. Smith this was changed by mutual consent in a letter dated November 12, 2009 and signed by Mr. Smith on November 13, 2009. Under this revised structure, Mr. Smith agreed to defer his benefit until age 65 (or until termination of employment if sooner).
Nonqualified Deferred Compensation (NQDC) Table:
Name
(a) | Executive
Contributions
in Last FY
($)
(b) | Registrant
Contributions
in Last FY
($)
(c) | Aggregate
Earnings
in Last FY
($)
(d) | Aggregate
Withdrawals/
Distributions
($)
(e) | Aggregate
Balance
at Last FYE
($)
(f) | | Stephen M. Smith | 140,718 | 96,384 | 27,778 | 0 | 736,188 | | Mark J. Allin | N/A | N/A | N/A | N/A | N/A | | John A. Kritzmacher | 0 | 46,497 | 1,312 | 0 | 50,008 | | Gary Rinck | 150,703 | 35,900 | 170,284 | 358,612 | 2,143,045 | | Joseph S. Heider | 81,888 | 25,445 | 37,226 | 0 | 786,043 | | John W. Semel | 0 | 22,892 | 8 | 0 | 24,746 | | Steven J. Miron | 50,100 | 35,083 | 9,030 | 0 | 212,349 |
| Participants in the company’s Nonqualified Deferred Compensation Plan (the “NQDC Plan”) may elect to defer up to 25% of their base salary and up to 100% of their annual cash incentive compensation. If the participant’s Company matching contributions under the Employees’ Savings Plan are restricted due to code contribution or compensation limitations, he/she is eligible to receive a Company matching contribution of up to 1.5% of pay in excess of qualified plan limits under the NQDC Plan. Mirroring Company contributions under the Savings Plan, the Company also makes Basic Retirement Contributions, and may make Discretionary Contributions, recognizing pay in excess of qualified plan limits, under the NQDC Plan. While Mr. Allin was a UK-based executive, he was not eligible to participate in the NQDC Plan. As elected in 2009, Mr. Rinck received an in-service distribution from the NQDC Plan on January 31, 2015, representing the value of deferrals of CY 2010 base and incentive pay. |
| Participants designate one or more investment funds which are used to measure the income credited to their account. Although not required to do so, the Company has elected to invest the funds deferred under the plan substantially as directed by the participants. The funds currently available under the NQDC Plan and their returns for the last fiscal year are shown below: | Deferred Compensation Funds | | Rate of Return for 1 year
ending 04/30/2017 | | Goldman Sachs VIT Government Money Market | | 0.37% | | | Fidelity VIP Investment Grade Bond Svc | | 2.59% | | | MFS VIT Value | | 14.23% | | | Fidelity VIP Index 500 | | 17.81% | | | American Funds IS Growth 2 | | 23.22% | | | Nationwide VIT Mid Cap Index I | | 19.96% | | | DFA VA US Targeted Value | | 21.58% | | | Vanguard VIF Small Company Growth | | 26.39% | | | MFS VIT II International Value | | 11.83% | | | MFS VIT II International Growth | | 12.79% | | | Northwestern Mutual Life Insurance | | 5.26% | | | | Rate of Return for 1 year
ending 04/30/2015 | | | | | Vanguard VIF Money Market | | | 0.10 | % | PIMCO VIT Total Return | | | 4.09 | % | PIMCO VIT Real Return | | | 1.62 | % | MFS VIT Value | | | 9.97 | % | Fidelity VIP Index 500 | | | 12.87 | % | American Funds IS Growth | | | 15.69 | % | Invesco VI American Value I | | | 11.70 | % | Fidelity VIP Mid Cap | | | 10.74 | % | Royce Capital Small Cap | | | 6.09 | % | Vanguard VIF Small Company Growth | | | 13.63 | % | MFS VIT II International Value | | | 8.37 | % | MFS VIT II International Growth | | | 2.31 | % | Northwestern Mutual Life Insurance | | | 5.30 | % |
Account balances under the NQDC Plan are distributed to participants in accordance with their individual elections made at the time of the deferral election. Participants may elect to receive their contributions on a designated date or upon separation of service, subject to the restrictions of Section 409A of the Code. Distributions on account of termination or retirement are available in a lump sum or annual installments over up to 15 years. Amounts in column (b) are included in columns (c) and (g) on the Summary Compensation Table. Payments Upon Termination and Change of Control Tables:
| Stephen M. Smith | Executive Benefits and
Payments Upon Termination | | Retirement | | Resignation
without
Good Reason | | | Dismissal
without Cause
or Resignation
for Good Reason
(absent CoC) | | | | Dismissal
without Cause
or Resignation
for Good Reason
(following CoC) | | | Compensation: | | | | | | | | | | Severance - Base Salary | | $ | 0 | | | $ | 0 | | | $ | 1,840,000 | | | $ | 1,840,000 | | | Severance – Annual Incentive | | $ | 0 | | | $ | 0 | | | $ | 0 | | | $ | 2,576,000 | | | Prorated Annual Incentive | | $ | 0 | | | $ | 0 | | | $ | 0 | | | $ | 1,288,000 | | ELTIP – Restricted Performance
Share Units | | $ | 0 | | | $ | 0 | | | $ | 0 | | | $ | 2,468,592 | | Restricted Stock (Performance
Shares Earned but Not Vested) (1) | | $ | 1,883,297 | | | $ | 1,883,297 | | | $ | 1,883,297 | | | $ | 1,883,297 | | | Restricted Stock (Time based) | | $ | 0 | | | $ | 0 | | | $ | 0 | | | $ | 972,648 | | | Stock Options (2) | | $ | 0 | | | $ | 0 | | | $ | 0 | | | $ | 2,289,500 | | | Benefits (3) | | $ | 0 | | | $ | 0 | | | $ | 24,866 | | | $ | 49,732 | | | SERP (4) | | $ | 2,900,480 | | | $ | 2,900,480 | | | $ | 2,900,480 | | | $ | 5,314,497 | | | Excess Plan (4) | | $ | 3,276,093 | | | $ | 3,276,093 | | | $ | 3,276,093 | | | $ | 3,276,093 | | | Qualified Plan (4) | | $ | 2,028,506 | | | $ | 2,028,506 | | | $ | 2,028,506 | | | $ | 2,028,506 | | | NQDC (5) | | $ | 736,187 | | | $ | 736,187 | | | $ | 736,187 | | | $ | 736,187 | | | Total: | | $ | 10,824,563 | | | $ | 10,824,563 | | | $ | 12,689,429 | | | $ | 24,723,052 | |
|
| | | | | | | | | | | | | | | | | Payments Upon | Mark J. Allin | | Termination
and Change of
Control Tables: | Executive Benefits and
Payments Upon Termination | | Retirement | | Resignation
without
Good Reason | | Dismissal
without Cause
or Resignation
for Good
Reason
(absent CoC) | | Dismissal
without Cause
or Resignation
for Good
Reason
(following CoC) | | | | Compensation: | | | | | | | | | | | | | | | | Severance – Base Salary | | $ | 0 | | $ | 0 | | $ | 1,560,000 | | $ | 1,560,000 | | | | Severance – Annual Incentive | | $ | 0 | | $ | 0 | | $ | 0 | | $ | 1,872,000 | | | | Prorated Annual Incentive | | $ | 0 | | $ | 0 | | $ | 0 | | $ | 936,000 | | | | ELTIP – Restricted Performance Share Units | | $ | 0 | | $ | 0 | | $ | 0 | | $ | 2,498,771 | | | | Restricted Stock (Performance Shares Earned but Not Vested)(1) | | $ | 163,370 | | $ | 163,370 | | $ | 163,370 | | $ | 163,370 | | | | Restricted Stock (Time based) | | $ | 0 | | $ | 0 | | $ | 0 | | $ | 1,159,519 | | | | Stock Options(2) | | $ | 0 | | $ | 0 | | $ | 0 | | $ | 100,066 | | | | Benefits(3) | | $ | 0 | | $ | 0 | | $ | 59,057 | | $ | 59,057 | | | | SERP(4) | | $ | 989,791 | | $ | 989,791 | | $ | 989,791 | | $ | 2,015,436 | | | | Excess Plan(4) | | | N/A | | | N/A | | | N/A | | | N/A | | | | Qualified Plan(4) | | $ | 1,234,817 | | $ | 1,234,817 | | $ | 1,234,817 | | $ | 1,234,817 | | | | NQDC(5) | | $ | 84,421 | | $ | 84,421 | | $ | 84,421 | | $ | 84,421 | | | | Total: | | $ | 2,472,399 | | $ | 2,472,399 | | $ | 4,091,456 | | $ | 11,683,456 | |
| (1) | Vesting accelerates in all 4 termination scenarios since the executive has achieved age 55 and 10 years of service criteria. | (2) | Reflects the intrinsic value of those stock options that become vested because of the change of control based on the April 30, 2015 closing stock price ($56.88) |
| (2) | Reflects the intrinsic value of those stock options that become vested because of the change of control based on the April 28, 2017 closing stock price ($52.70). |
| (3) | Presumes benefits are similar to those available to salaried employees and therefore only need to be disclosed in the dismissal columns. | (4) | Amounts shown are lump sum values (based on the PPA mortality table and the Section 417(e)(3) segment rates in effect for April 2015) |
| (4) | Amounts shown are lump sum values (based on the PPA mortality table and the Section 417(e)(3) segment rates in effect for April 2017), even though plan documents only permit annuity payments, except on termination following a change of control. Annual benefits are: | | Qualified: | $182,068 / year as a life annuity | | Excess: | $207,249 / year as a life annuity | | SERP: | $196,109 |
| UK Qualified: | | $70,346 / year as a life annuity | | | Excess: | | N/A / year as a life annuity | | | SERP: | | $60,494 / year as a life annuity | | | | | | | |
| (5) | Balance is paid as a lump sum on termination following a change of control; otherwise distribution is available in a lump sum or annual installments over up to 15 years. |
| | Executive Benefits and
Payments Upon Termination | | Retirement | | Resignation
without
Good Reason | | Dismissal
without Cause
or Resignation
for Good
Reason
(absent CoC) | | Dismissal
without Cause
or Resignation
for Good
Reason
(following CoC) | | | | Compensation: | | | | | | | | | | | | | | | | Severance – Base Salary | | $ | 0 | | $ | 0 | | $ | 665,000 | | $ | 1,330,000 | | | | Severance – Annual Incentive | | $ | 0 | | $ | 0 | | $ | 0 | | $ | 1,263,500 | | | | Prorated Annual Incentive | | $ | 0 | | $ | 0 | | $ | 0 | | $ | 631,750 | | | | ELTIP – Restricted Performance Share Units | | $ | 0 | | $ | 0 | | $ | 0 | | $ | 1,228,964 | | | | Restricted Stock (Performance Shares Earned but Not Vested) | | $ | 0 | | $ | 0 | | $ | 0 | | $ | 281,682 | | | | Restricted Stock (Time based) | | $ | 0 | | $ | 0 | | $ | 0 | | $ | 1,025,478 | | | | Stock Options(1) | | $ | 0 | | $ | 0 | | $ | 0 | | $ | 395,100 | | | | Benefits(2) | | $ | 0 | | $ | 0 | | $ | 30,124 | | $ | 60,248 | | | | SERP(3) | | | N/A | | | N/A | | | N/A | | | N/A | | | | Excess Plan(3) | | | N/A | | | N/A | | | N/A | | | N/A | | | | Qualified Plan(3) | | | N/A | | | N/A | | | N/A | | | N/A | | | | NQDC(4) | | $ | 151,169 | | $ | 151,169 | | $ | 151,169 | | $ | 151,169 | | | | Total: | | $ | 151,169 | | $ | 151,169 | | $ | 846,293 | | $ | 6,367,890 | |
| (1) | Reflects the intrinsic value of those stock options that become vested because of the change of control based on the April 28, 2017 closing stock price ($52.70). |
| Mark J. Allin | Executive Benefits and
Payments Upon Termination | | Retirement | | Resignation
without
Good Reason | | Dismissal
without Cause
or Resignation for Good Reason (absent CoC) | | Dismissal
without Cause
or Resignation
for Good Reason
(following CoC) | | Compensation: | | | | | | | | | | Severance - Base Salary | | $ | 0 | | | $ | 0 | | | $ | 907,353 | | | $ | 1,209,804 | | | Severance – Annual Incentive | | $ | 0 | | | $ | 0 | | | $ | 0 | | | $ | 1,149,314 | | | Prorated Annual Incentive | | $ | 0 | | | $ | 0 | | | $ | 0 | | | $ | 574,657 | | ELTIP – Restricted Performance
Share Units | | $ | 0 | | | $ | 0 | | | $ | 0 | | | $ | 557,424 | | Restricted Stock (Performance
Shares Earned but Not Vested) | | $ | 0 | | | $ | 0 | | | $ | 0 | | | $ | 167,853 | | | Restricted Stock (Time based) | | $ | 0 | | | $ | 0 | | | $ | 0 | | | $ | 221,832 | | | Stock Options (1) | | $ | 0 | | | $ | 0 | | | $ | 0 | | | $ | 589,509 | | | Benefits (2) | | $ | 0 | | | $ | 0 | | | $ | 7,557 | | | $ | 15,114 | | | SERP (3) | | $ | 703,158 | | | $ | 703,158 | | | $ | 703,158 | | | $ | 2,258,382 | | | Excess Plan (3) | | | N/A | | | | N/A | | | | N/A | | | | N/A | | | Qualified Plan (3) | | $ | 465,327 | | | $ | 465,327 | | | $ | 465,327 | | | $ | 465,327 | | | NQDC | | $ | 0 | | | $ | 0 | | | $ | 0 | | | $ | 0 | | | Total: | | $ | 1,168,485 | | | $ | 1,168,485 | | | $ | 2,083,395 | | | $ | 7,209,216 | |
(1) | Reflects the intrinsic value of those stock options that become vested because of the change of control based on the April 30, 2015 closing stock price ($56.88). | | (2) | Presumes benefits are similar to those available to salaried employees and therefore only need to be disclosed in the dismissal columns. | (3) | Amounts shown are lump sum values (based on the PPA mortality table and the Section 417(e)(3) segment rates in effect for April 2015), even though plan documents only permit annuity payments, except on termination following a change of control. Annual benefits are: | | Qualified: | $55,070 / year as a life annuity | | Excess: | N/A / year as a life annuity | | SERP: | $94,401 / year as a life annuity |
| John A. Kritzmacher | Executive Benefits and
Payments Upon Termination | | Retirement | | Resignation
without
Good Reason | | Dismissal
without Cause
or Resignation
for Good Reason
(absent CoC) | | Dismissal
without Cause
or Resignation
for Good Reason
(following CoC) | | Compensation: | | | | | | | | | | Severance - Base Salary | | $ | 0 | | | $ | 0 | | | $ | 620,000 | | | $ | 1,240,000 | | | Severance – Annual Incentive | | $ | 0 | | | $ | 0 | | | $ | 0 | | | $ | 1,178,000 | | | Prorated Annual Incentive | | $ | 0 | | | $ | 0 | | | $ | 0 | | | $ | 589,000 | | ELTIP – Restricted Performance
Share Units | | $ | 0 | | | $ | 0 | | | $ | 0 | | | $ | 1,063,656 | | Restricted Stock (Performance
Shares Earned but Not Vested) | | $ | 0 | | | $ | 0 | | | $ | 0 | | | $ | 0 | | | Restricted Stock (Time based) | | $ | 0 | | | $ | 0 | | | $ | 0 | | | $ | 910,080 | | | Stock Options (1) | | $ | 0 | | | $ | 0 | | | $ | 0 | | | $ | 1,041,000 | | | Benefits (2) | | $ | 0 | | | $ | 0 | | | $ | 29,093 | | | $ | 58,186 | | | SERP (3) | | | N/A | | | | N/A | | | | N/A | | | | N/A | | | Excess Plan (3) | | | N/A | | | | N/A | | | | N/A | | | | N/A | | | Qualified Plan (3) | | | N/A | | | | N/A | | | | N/A | | | | N/A | | | NQDC (4) | | $ | 50,008 | | | $ | 50,008 | | | $ | 50,008 | | | $ | 50,008 | | | Total: | | $ | 50,008 | | | $ | 50,008 | | | $ | 699,101 | | | $ | 6,129,930 | |
(1) | Reflects the intrinsic value of those stock options that become vested because of the change of control based on the April 30, 2015 closing stock price ($56.88). | (2) | Presumes benefits are similar to those available to salaried employees and therefore only need to be disclosed in the dismissal columns. | | (3) | Mr. Kritzmacher is not eligible for any DB benefits (Qualified, Excess and SERP) because he was hired in June 2013 and had not completed one year of service as of the plans’ June 30, 2013 freeze date. |
| (4) | Balance is paid as a lump sum on termination following a change of control; otherwise distribution is available in a lump sum or annual installments over up to 15 years. |
| Gary Rinck | Executive Benefits and
Payments Upon Termination | | Retirement | | Resignation
without
Good Reason | | Dismissal
without Cause
or Resignation
for Good Reason
(absent CoC) | | Dismissal
without Cause
or Resignation
for Good Reason
(following CoC) | | Compensation: | | | | | | | | | | Severance - Base Salary | | $ | 0 | | | $ | 0 | | | $ | 802,500 | | | $ | 1,070,000 | | | Severance – Annual Incentive | | $ | 0 | | | $ | 0 | | | $ | 0 | | | $ | 802,500 | | | Prorated Annual Incentive | | $ | 0 | | | $ | 0 | | | $ | 0 | | | $ | 401,250 | | ELTIP – Restricted Performance
Share Units | | $ | 0 | | | $ | 0 | | | $ | 0 | | | $ | 597,240 | | Restricted Stock (Performance Shares
Earned but Not Vested) (1) | | $ | 223,709 | | | $ | 223,709 | | | $ | 223,709 | | | $ | 223,709 | | | Restricted Stock (Time based) | | $ | 0 | | | $ | 0 | | | $ | 0 | | | $ | 238,896 | | | Stock Options (2) | | $ | 0 | | | $ | 0 | | | $ | 0 | | | $ | 560,230 | | | Benefits (3) | | $ | 0 | | | $ | 0 | | | $ | 9,474 | | | $ | 18,948 | | | SERP (4) | | $ | 2,947,284 | | | $ | 2,947,284 | | | $ | 2,947,284 | | | $ | 3,324,101 | | | Excess Plan (4) | | $ | 897,342 | | | $ | 897,342 | | | $ | 897,342 | | | $ | 897,342 | | | Qualified Plan (4) | | $ | 335,640 | | | $ | 335,640 | | | $ | 335,640 | | | $ | 335,640 | | | NQDC (5) | | $ | 2,143,044 | | | $ | 2,143,044 | | | $ | 2,143,044 | | | $ | 2,143,044 | | | Total: | | $ | 6,547,019 | | | $ | 6,547,019 | | | $ | 7,358,993 | | | $ | 10,612,900 | |
| | Executive Benefits and
Payments Upon Termination | | Retirement | | Resignation
without
Good Reason | | Dismissal
without Cause
or Resignation
for Good
Reason
(absent CoC) | | Dismissal
without Cause
or Resignation
for Good
Reason
(following CoC) | | | | Compensation: | | | | | | | | | | | | | | | | Severance – Base Salary | | $ | 0 | | $ | 0 | | $ | 825,000 | | $ | 1,100,000 | | | | Severance – Annual Incentive | | $ | 0 | | $ | 0 | | $ | 0 | | $ | 825,000 | | | | Prorated Annual Incentive | | $ | 0 | | $ | 0 | | $ | 0 | | $ | 412,500 | | | | ELTIP – Restricted Performance Share Units | | $ | 0 | | $ | 0 | | $ | 0 | | $ | 571,268 | | | | Restricted Stock (Performance Shares Earned but Not Vested)(1) | | $ | 177,494 | | $ | 177,494 | | $ | 177,494 | | $ | 177,494 | | | | Restricted Stock (Time based) | | $ | 0 | | $ | 0 | | $ | 0 | | $ | 370,086 | | | | Stock Options(2) | | $ | 0 | | $ | 0 | | $ | 0 | | $ | 94,166 | | | | Benefits(3) | | $ | 0 | | $ | 0 | | $ | 25,457 | | $ | 33,943 | | | | SERP(4) | | $ | 3,174,638 | | $ | 3,174,638 | | $ | 3,174,638 | | $ | 3,201,489 | | | | Excess Plan(4) | | $ | 950,145 | | $ | 950,145 | | $ | 950,145 | | $ | 950,145 | | | | Qualified Plan(4) | | $ | 355,387 | | $ | 355,387 | | $ | 355,387 | | $ | 355,387 | | | | NQDC(5) | | $ | 3,239,450 | | $ | 3,239,450 | | $ | 3,239,450 | | $ | 3,239,450 | | | | Total: | | $ | 7,897,114 | | $ | 7,897,114 | | $ | 8,747,571 | | $ | 11,330,927 | |
| (1) | Vesting accelerates in all 4 termination scenarios since the executive has achieved age 55 and 10 years of service criteria. | (2) | Reflects the intrinsic value of those stock options that become vested because of the change of control based on the April 30, 2015 closing stock price ($56.88) |
| (2) | Reflects the intrinsic value of those stock options that become vested because of the change of control based on the April 28, 2017 closing stock price ($52.70). |
| (3) | Presumes benefits are similar to those available to salaried employees and therefore only need to be disclosed in the dismissal columns. | (4) | Amounts shown are lump sum values (based on the PPA mortality table and the Section 417(e)(3) segment rates in effect for April 2015) |
| (4) | Amounts shown are lump sum values (based on the PPA mortality table and the Section 417(e)(3) segment rates in effect for April 2017), even though plan documents only permit annuity payments, except on termination following a change of control. Annual benefits are: | | Qualified: | $24,008 / year as a life annuity | | Excess: | $64,186 / year as a life annuity | | SERP: | $338,776 |
| | | | | Qualified: | $26,396 / year as a life annuity | | | Excess: | $70,571 / year as a life annuity | | | SERP: | $365,586 / year as a 10 year certain | (5) | Balance is paid as a lump sum on termination following a change of control; otherwise distribution is available in a lump sum or annual installments over up to 15 years. |
| (5) | Balance is paid as a lump sum on termination following a change of control; otherwise distribution is available in a lump sum or annual installments over up to 15 years. |
| | Executive Benefits and
Payments Upon Termination | | Retirement | | Resignation
without
Good Reason | | Dismissal
without Cause or Resignation
for Good
Reason
(absent CoC) | | Dismissal
without Cause or Resignation
for Good
Reason
(following CoC) | | | | Compensation: | | | | | | | | | | | | | | | | Severance – Base Salary | | $ | 0 | | $ | 0 | | $ | 455,000 | | $ | 682,500 | | | | Severance – Annual Incentive | | $ | 0 | | $ | 0 | | $ | 0 | | | 0. | | | | Prorated Annual Incentive | | $ | 0 | | $ | 0 | | $ | 0 | | $ | 0 | | | | ELTIP – Restricted Performance Share Units | | $ | 0 | | $ | 0 | | $ | 0 | | $ | 504,339 | | | | Restricted Stock (Performance Shares Earned but Not Vested) | | $ | 0 | | $ | 0 | | $ | 0 | | $ | 70,460 | | | | Restricted Stock (Time based) | | $ | 0 | | $ | 0 | | $ | 0 | | $ | 284,844 | | | | Stock Options(1) | | $ | 0 | | $ | 0 | | $ | 0 | | $ | 37,535 | | | | Benefits(2) | | $ | 0 | | $ | 0 | | $ | 24,385 | | $ | 36,578 | | | | SERP(3) | | | N/A | | | N/A | | | N/A | | | N/A | | | | Excess Plan(3) | | $ | 79,427 | | $ | 79,427 | | $ | 79,427 | | $ | 79,427 | | | | Qualified Plan(3) | | $ | 67,201 | | $ | 67,201 | | $ | 67,201 | | $ | 67,201 | | | | NQDC(4) | | $ | 71,496 | | $ | 71,496 | | $ | 71,496 | | $ | 71,496 | | | | Total: | | $ | 218,124 | | $ | 218,124 | | $ | 697,509 | | $ | 1,834,379 | |
| (1) | Reflects the intrinsic value of those stock options that become vested because of the change of control based on the April 28, 2017 closing stock price ($52.70). | | | | | | (2) | Presumes benefits are similar to those available to salaried employees and therefore only need to be disclosed in the dismissal columns. | | | | | (3) | Amounts shown are lump sum values (based on the PPA mortality table and the Section 417(e)(3) segment rates in effect for April 2017), even though plan documents only permit annuity payments, except on termination following a change of control. Annual benefits are: | | | | | | Qualified: | $13,156 / year as a life annuity | | | Excess: | $15,550 / year as a life annuity | | | SERP: | N/A / year as a life annuity | | | | | | | (4) | Balance is paid as a lump sum on termination following a change of control; otherwise distribution is available in a lump sum or annual installments over up to 15 years. |
| Joseph S. Heider | Executive Benefits and
Payments Upon Termination | | Retirement | | Resignation
without
Good Reason | | Dismissal
without Cause
or Resignation
for Good Reason
(absent CoC) | | Dismissal
without Cause
or Resignation
for Good Reason
(following CoC) | | Compensation: | | | | | | | | | | Severance - Base Salary | | $ | 0 | | | $ | 0 | | | $ | 780,000 | | | $ | 780,000 | | | Severance – Annual Incentive | | $ | 0 | | | $ | 0 | | | $ | 0 | | | $ | 741,000 | | | Prorated Annual Incentive | | $ | 0 | | | $ | 0 | | | $ | 0 | | | $ | 370,500 | | ELTIP – Restricted Performance
Share Units | | $ | 0 | | | $ | 0 | | | $ | 0 | | | $ | 466,416 | | Restricted Stock (Performance Shares
Earned but Not Vested) (1) | | $ | 150,277 | | | $ | 150,277 | | | $ | 150,277 | | | $ | 150,277 | | | Restricted Stock (Time based) | | $ | 0 | | | $ | 0 | | | $ | 0 | | | $ | 193,392 | | | Stock Options (2) | | $ | 0 | | | $ | 0 | | | $ | 0 | | | $ | 411,073 | | | Benefits (3) | | $ | 0 | | | $ | 0 | | | $ | 18,151 | | | $ | 36,302 | | | SERP (4) | | $ | 1,571,190 | | | $ | 1,571,190 | | | $ | 1,571,190 | | | $ | 3,265,016 | | | Excess Plan (4) | | $ | 282,350 | | | $ | 282,350 | | | $ | 282,350 | | | $ | 282,350 | | | Qualified Plan (4) | | $ | 430,481 | | | $ | 430,481 | | | $ | 430,481 | | | $ | 430,481 | | | NQDC (5) | | $ | 786,043 | | | $ | 786,043 | | | $ | 786,043 | | | $ | 786,043 | | | Total: | | $ | 3,220,341 | | | $ | 3,220,341 | | | $ | 4,018,492 | | | $ | 7,912,850 | |
| | Executive Benefits and
Payments Upon Termination | | Retirement | | Resignation
without
Good Reason | | Dismissal
without Cause or Resignation
for Good
Reason
(absent CoC) | | Dismissal
without Cause or Resignation
for Good
Reason
(following CoC) | | | | Compensation: | | | | | | | | | | | | | | | | Severance – Base Salary | | $ | 0 | | $ | 0 | | $ | 475,000 | | $ | 570,000 | | | | Severance – Annual Incentive | | $ | 0 | | $ | 0 | | $ | 0 | | $ | 0 | | | | Prorated Annual Incentive | | $ | 0 | | $ | 0 | | $ | 0 | | $ | 0 | | | | ELTIP – Restricted Performance Share Units | | $ | 0 | | $ | 0 | | $ | 0 | | $ | 285,634 | | | | Restricted Stock (Performance Shares Earned but Not Vested)(1) | | $ | 53,543 | | $ | 53,543 | | $ | 53,543 | | $ | 53,543 | | | | Restricted Stock (Time based) | | $ | 0 | | $ | 0 | | $ | 0 | | $ | 174,964 | | | | Stock Options(2) | | $ | 0 | | $ | 0 | | $ | 0 | | $ | 28,974 | | | | Benefits(3) | | $ | 0 | | $ | 0 | | $ | 22,819 | | $ | 27,383 | | | | SERP(4) | | | N/A | | | N/A | | | N/A | | | N/A | | | | Excess Plan(4) | | $ | 31,729 | | $ | 31,729 | | $ | 31,729 | | $ | 31,729 | | | | Qualified Plan(4) | | $ | 17,267 | | $ | 17,267 | | $ | 17,267 | | $ | 17,267 | | | | NQDC(5) | | $ | 43,846 | | $ | 43,846 | | $ | 43,846 | | $ | 43,846 | | | | Total: | | $ | 146,385 | | $ | 146,385 | | $ | 644,204 | | $ | 1,233,340 | |
| (1) | Vesting accelerates in all 4 termination scenarios since the executive has achieved age 55 and 10 years of service criteria. | (2) | Reflects the intrinsic value of those stock options that become vested because of the change of control based on the April 30, 2015 closing stock price ($56.88). | | | | | (2) | Reflects the intrinsic value of those stock options that become vested because of the change of control based on the April 28, 2017 closing stock price ($52.70). | | | | | (3) | Presumes benefits are similar to those available to salaried employees and therefore only need to be disclosed in the dismissal columns. | | |
(4) | Amounts shown are lump sum values (based on the PPA mortality table and the Section 417(e)(3) segment rates in effect for April 2015), even though plan documents only permit annuity payments, except on termination following a change of control. Annual benefits are: | | Qualified: | $26,858 / year as a life annuity | | | Excess: | $17,616 / year as a life annuity | | | SERP: | $98,028 / year as a life annuity | | (5) | Balance is paid as a lump sum on termination following a change of control; otherwise distribution is available in a lump sum or annual installments over up to 15 years. |
| John W. Semel | Executive Benefits and
Payments Upon Termination | | Retirement | | Resignation
without
Good Reason | | Dismissal
without Cause
or Resignation
for Good Reason
(absent CoC) | | Dismissal
without Cause
or Resignation
for Good Reason
(following CoC) | | Compensation: | | | | | | | | | | Severance - Base Salary | | $ | 0 | | | $ | 0 | | | $ | 396,550 | | | $ | 396,550 | | | Severance – Annual Incentive | | $ | 0 | | | $ | 0 | | | $ | 0 | | | $ | 0 | | | Prorated Annual Incentive | | $ | 0 | | | $ | 0 | | | $ | 0 | | | $ | 0 | | ELTIP – Restricted Performance
Share Units | | $ | 0 | | | $ | 0 | | | $ | 0 | | | $ | 187,704 | | Restricted Stock (Performance Shares
Earned but Not Vested) | | $ | 0 | | | $ | 0 | | | $ | 0 | | | $ | 73,546 | | | Restricted Stock (Time based) | | $ | 0 | | | $ | 0 | | | $ | 0 | | | $ | 386,784 | | | Stock Options (1) | | $ | 0 | | | $ | 0 | | | $ | 0 | | | $ | 194,309 | | | Benefits (2) | | $ | 0 | | | $ | 0 | | | $ | 11,492 | | | $ | 22,984 | | | SERP (3) | | | N/A | | | | N/A | | | | N/A | | | | N/A | | | Excess Plan (3) | | $ | 65,760 | | | $ | 65,760 | | | $ | 65,760 | | | $ | 65,760 | | | Qualified Plan (3) | | $ | 55,638 | | | $ | 55,638 | | | $ | 55,638 | | | $ | 55,638 | | | NQDC (4) | | $ | 24,746 | | | $ | 24,746 | | | $ | 24,746 | | | $ | 24,746 | | | Total: | | $ | 146,144 | | | $ | 146,144 | | | $ | 554,186 | | | $ | 1,408,021 | |
(1) | Reflects the intrinsic value of those stock options that become vested because of the change of control based on the April 30, 2015 closing stock price ($56.88). | | (2) | Presumes benefits are similar to those available to salaried employees and therefore only need to be disclosed in the dismissal columns. | | (3) | Amounts shown are lump sum values (based on the PPA mortality table and the Section 417(e)(3) segment rates in effect for April 2015), even though plan documents only permit annuity payments, except on termination following a change of control. Annual benefits are: | | | Qualified: | $13,156 / year as a life annuity | | | | Excess: | $15,550 / year as a life annuity | | | | SERP: | N/A / year as a life annuity | | | (4) | Balance is paid as a lump sum on termination following a change of control; otherwise distribution is available in a lump sum or annual installments over up to 15 years. | | | | | | | | | | | | (4) | Amounts shown are lump sum values (based on the PPA mortality table and the Section 417(e)(3) segment rates in effect for April 2017), even though plan documents only permit annuity payments, except on termination following a change of control. Annual benefits are: | | | | | | Qualified: | $1,163 / year as a life annuity | | | Excess: | $2,137 / year as a life annuity | | | SERP: | N/A / year as a life annuity | | | | | (5) | Balance is paid as a lump sum on termination following a change of control; otherwise distribution is available in a lump sum or annual installments over up to 15 years. |
| The preceding tables—Potential Payments upon Termination or Change of Control—show the payments and benefits our named executives would receive in connection with a variety of employment termination scenarios and upon a change of control. For the named executive officers, the information assumes the terminations and change of control occurred on April 30, 2015.2017. All of the payments and benefits described below would be provided by the Company or its affiliates. | | | | The tables do not include amounts such as base salary, annual incentives and stock awards the named executive officers earned due to employment through April 30, 2015.2017. | | | | Under the 2009 and 2014 Key Employee Stock Plans, the Compensation Committee may elect to accelerate the vesting of performance stock which has been earned, but not vested, for a retiring executive. Payout for current cycles will be made in shares following the end of the performance cycle. Some of the
| | The named officers and certain other executives are covered by employment agreements or severance agreementsthe Executive Severance Policy which provide for the following in the event of a “without cause termination” or “constructive discharge” without a change ofin control: | · | Severance—base salary: Messrs. Smith, Allin and Heider— |
| ● Severance—base salary: Mr. Allin—24 months; Mr. Rinck—18 months; Mr. Sugerman—15 months; Messrs. Kritzmacher and Semel—12 months. |
| · | | | | ●Performance Share Units—Mr. Smith—accelerated vesting of all earned Performance Share Units for completed cycles. | | | | ● Company-paid health and welfare benefits, for their respective severance periods: | | | | ● Relocation of household goods back to UK for Mr. Allin. |
| · | Company-paid health and welfare benefits, for their respective severance periods: Messrs. Smith, Allin and Heider—24 months; Mr., Rinck—18 months; Mr. Kritzmacher—12 months. |
The named officers and certain other executives are covered by employment agreements which provide for the following, in the event of a “without cause termination” or “constructive discharge” following a change ofin control, as defined: | · | Severance—base salary: Messrs. Smith, Allin, Kritzmacher, Rinck and Heider — 24 months. |
| · | Severance—annual target incentive—Messrs. Smith, Allin, Kritzmacher, Rinck and Heider — 2 years. |
| · | Company-paid health and welfare benefits--Messrs. Smith, Allin, Kritzmacher, Rinck and Heider — 24 months. |
| · | Messrs. Smith, Allin, Rinck and Heider - a lump-sum payment under the 1989 or 2005 SERP, equal to the present value of the benefit to which the participant would have been entitled if he/she had attained age 65 and retired on the date of such termination of employment. |
| · | Messrs. Smith, Rinck and Heider — a lump-sum payment of the accrued benefit under the Excess Plan. |
| · | Messrs. Smith, Kritzmacher, Rinck and Heider● Severance—base salary: Messrs. Allin, Kritzmacher and Rinck— 24 months, Messrs. Semel and Sugerman— 18 months. ● Severance—annual target incentive—Messrs. Allin, Kritzmacher and Rinck— 2 years, Messrs. Semel and Sugerman— 1½ years. ● Company-paid health and welfare benefits--Messrs. Allin, Kritzmacher and Rinck — 24 months, Messrs. Semel and Sugerman— 18 months. ● Messrs. Allin and Rinck – a lump-sum payment under the 1989 or 2005 SERP, equal to the present value of the benefit to which the participant would have been entitled if he/she had attained age 65 and retired on the date of such termination of employment. ● Mr. Rinck — a lump-sum payment of the accrued benefit under the Excess Plan. ● Messrs. Allin, Kritzmacher, Rinck, Semel and Sugerman — immediate payment of the current balance of the NQDC Plan. |
| Upon a “change of control”,in control,” as defined, under the 2009 and 2014 Key Employee Stock Plans, for grants made prior to June 2011, | · | All outstanding options shall become immediately exercisable up to the full number of shares covered by the option.Plans: |
| · | All outstanding target performance shares shall become immediately vested. |
| · | All shares of restricted stock that would otherwise remain subject to restrictions shall be free of such restrictions. |
| · | Beginning with the June 2011 equity awards, double-trigger | ● Double-trigger vesting of equity upon a change of control will apply in cases where the acquiring company is a publicly traded company, and that company assumes or replaces the outstanding equity. |
| · | In Fiscal 2012, the Company modified the executive employment agreements to eliminate excise tax “gross-ups” upon a change of control. | ● There are no excise tax “gross-ups”. |
| | “Change of Control” shall mean an event which shall occur if there is: |
| (i) | a change in the ownership of the Company; |
| (ii) | a change in the effective control of the Company; or |
| (iii) | a change in the ownership of a substantial portion of the assets of the Company. |
| (iii) | a change in the ownership of a substantial portion of the assets of the Company. |
For purposes of this definition, a change in the ownership occurs on the date on which any one person, or more than one person acting as a group (as defined in Treasury regulations 1.409A-2(i)(5)(v)(B)), acquires ownership of stock that, together with stock held by such person or group constitutes more than 50% of the total fair market value or total voting power of the stock of the Company. | | A change in the effective control occurs on the date on which either: |
| (i) | a person, or more than one person acting as a group (as defined in Treasury regulations 1.409A-2(i)(5)(v)(B)), acquires ownership of stock possessing 30% or more of the total voting power of the stock of the Company, taking into account all such stock acquired during the 12-month period ending on the date of the most recent acquisition, or |
| (ii) | a majority of the members of the Board of Directors is replaced during any 12-month period by directors whose appointment or election is not endorsed by a majority of the members of such Board of Directors prior to the date of the appointment or election, but only if no other corporation is a majority shareholder. |
A change in the ownership of a substantial portion of assets occurs on the date on which any one person, or more than one person acting as a group (as defined in Treasury regulations 1.409A-2(i)(5)(v)(B)), other than a person or group of persons that is related to the Company, acquires assets that have a total gross fair market value equal to or more than 40% of the total gross fair market value of all of the assets of the Company immediately prior to such acquisition or acquisitions, taking into account all such assets acquired during the 12-month period ending on the date of the most recent acquisition. The determination as to the occurrence ofappointment or election, but only if no other corporation is a majority shareholder.
|
A change in the ownership of a substantial portion of assets occurs on the date on which any one person, or more than one person acting as a group (as defined in Treasury regulations 1.409A-2(i)(5)(v)(B)), other than a person or group of persons that is related to the Company, acquires assets that have a total gross fair market value equal to or more than 40% of the total gross fair market value of all of the assets of the Company immediately prior to such acquisition or acquisitions, taking into account all such assets acquired during the 12-month period ending on the date of the most recent acquisition. The determination as to the occurrence of a Change of Control shall be based on objective facts and in accordance with the requirements of Code Section 409A and the regulations promulgated thereunder. | | DIRECTORS’DIRECTOR COMPENSATION | | | | | | Directors’ Compensation Fiscal 20152017 | | | | | | Our non-employee directors received an annual cash retainer of $80,000$100,000 and committee chairmen, with the exceptionchairs of the chairman of the Executive Committee,Audit, Governance, and Compensation Committees received an additional annual retainer of $15,000. No fees are paid for attendance at meetings. No non-employee director receives any other compensation from the Company, except for reimbursement of expenses incurred for attendance at Board meetings. Directorsin relation to service on the Board. In Fiscal 2017, directors who are employees dodid not receive an annual retainer for Board or committee service. In Fiscal 2017, Mr. Kissner received a Chairman Fee of $185,000, split 65% in cash and 35% in stock, in addition to an annual Director Fee of $100,000 and Director Grant equal to a value of $100,000. Pursuant to the 2014 Director Stock Plan, adopted by the shareholders at last year’s Annual Meeting,each of our non-employee directors receivereceived an annual award of Class A sharesCommon Stock equal to $100,000. On$100,000, with the amount of shares granted based on the stock price of John Wiley & Sons, Inc. Class A Common Stock at the close of the New York Stock Exchange on September 18, 2014,22, 2016. During Fiscal 2017 the Company awarded a total of 12,13122,855 Class A Common Shares to the non-employee directors, including which includes 1,937 shares were awardedissued to directors.Mr. Plummer in lieu of his cash Director’s fees under the Directors’ Deferred Stock Plan. All of our Directors, except Messrs. Pesce, Pence, and Dobson, defer their receipt of the shares and receive them as share equivalents under the Deferred Compensation Plan for Director as described in the following paragraph. The Company has established a Deferred Compensation Plan for Directors (the “Deferred Plan”), Amended and Restated as of January 1, 2009. Non-employee directors are eligible to participate, and may defer all or a portion of their annual cash retainer fees in the form of cash and/or Class A Common Stock. They may also defer their annual stock award. Seven |
| | In Fiscal 2017, seven of our eleventen non-employee directors currently participateparticipated in the Deferred Plan. Retainers deferred in cash accrue interest annually based on the prime rate. One of our current Directors defers receipt of his cash retainer in an interest bearing account. Retainers deferred in the form of Class A Common Stock receive dividend equivalent units based on the closing price of the Class A Common Stock on the record date.distribution date of the dividend. Deferred cash and/or stock is payable to the directors upon their retirement from the Board, either in a lump sum or in the form of annual instalments.installments disbursed on January 15th of each year following the retirement. Our active directors and their spouses are eligible to participate in the Company’s Matching Gift Program. The Company will match the first $1,000 given by the donor as follows: three-to-one on the first $500, anda one-to-one on the second $500,basis up to a maximum contribution of $2,000 per institution, per donor,$15,000 per calendar year.year, with no organization limit. Share ownership by each Director is encouraged. To this end, each Director is expected to own shares of common stock valued at not less than five times that Director’s annual cash compensation to which the Director is entitled for Board service. The table below indicates the total cash compensation received by each non-employee director and Mr. Jesse C. Wiley during Fiscal 2015.2017. | | | FY 2017 Director Compensation | | | | Name | | Cash Fee | | Chair Fee | | Stock Awards(2) | | All Other Compensation | | Total | | | Mari Jean Baker(3)(5) | | $100,000 | | $15,000 | | $100,000 | | $27,271.60 | | $242,272 | | | George Bell(3)(5) | | $100,000 | | $15,000 | | $100,000 | | $8,620.38 | | $223,620 | | | David Dobson(6) | | $50,000 | | | | $50,000 | | | | $100,000 | | | Laurie A. Leshin(3) | | $100,000 | | | | $100,000 | | $3,945.90 | | $203,946 | | | Matthew S. Kissner(1)(3)(5) | | $220,250 | | | | $164,750 | | $41,349.83 | | $426,350 | | | Eduardo Menascé(8) | | | | | | | | $12,917.92 | | $12,918 | | | Raymond W. McDaniel, Jr.(3) | | $100,000 | | $15,000 | | $100,000 | | $48,986.41 | | $263,722 | | | William J. Pesce | | $100,000 | | | | $100,000 | | | | $200,000 | | | William Pence | | $100,000 | | | | $100,000 | | | | $200,000 | | | William B. Plummer(3)(7) | | $100,000 | | | | $100,000 | | $51,952.48 | | $251,952 | | | Kalpana Raina(3) | | $100,000 | | | | $100,000 | | $16,460.56 | | $216,461 | | | Jesse C. Wiley(4) | | | | | | | | $192,366 | | $192,366 | |
| (1) | Mr. Kissner received additional cash compensation of $120,250 for his services as Chairman of the Board. |
| Name | Fees Earned
or Paid in Cash | | Stock Awards | | All Other
Compensation | | Total | | | | | | | | | | | Mari Jean Baker(2)(3) | $80,000.00 | | $100,000.00 | | $10,568.93 | | $190,568.93 | | George Bell(2)(3) | $80,000.00 | | $100,000.00 | | $1,515.55 | | $181,515.55 | | Linda P.B. Katehi(3)(7) | $0.00 | | $0.00 | | $3,780.37 | | $3,780.37 | | Matthew S. Kissner*(2)(3)(8) | $95,000.00 | | $100,000.00 | | $60,607.06 | | $255,607.06 | | Raymond W. McDaniel, Jr.*(2)(3)(5) | $95,000.00 | | $100,000.00 | | $34,041.55 | | $218,551.52 | | Eduardo Menasce(2)(3) | $80,000.00 | | $100,000.00 | | $12,709.13 | | $192,709.13 | | William B. Plummer(1)(2)(3) | $80,000.00 | | $100,000.00 | | $37,933.31 | | $217,933.31 | | William J. Pesce(3)(6) | $80,000.00 | | $100,000.00 | | $4,000.00 | | $184,000.00 | | Kalpana Raina*(2)(3) | $95,000.00 | | $100,000.00 | | $10,314.49 | | $205,314.49 | | Peter Booth Wiley(3)(4) | $0.00 | | $0.00 | | $565,250.00 | | $565,250.00 | | Jesse Wiley(6) | $0.00 | | $0.00 | | $164,600.00 | | $164,600.00 |
| * | Committee Chair | (2) | On September 22, 2016, each of our then sitting non-employee Directors received an annual stock award of 1,995 shares of Class A Common Stock based on the closing price of $50.13. In addition to the Non-employee Director grant, Mr. Kissner received an additional 1,291.5 Class A Common Stock at $50.13 for his service as Chairman of the Board. |
| (1) | Effective January 1, 2009, Mr. Plummer has deferred receipt of his annual cash retainer fees in the form of stock.
| (3) | The amounts in All Other Compensation include the cash value of dividends accrued under the Deferred Compensation Plan and, in the case of Mr. McDaniel, $17,722 in interest credited to his Deferred Cash Compensation Plan in Fiscal 2017 of which, $5,403 is forfeitable if Mr. McDaniel resigns his position as a Director before December 31, 2017. |
| (2) | On September 18, 2014, each of our non-employee Directors received an annual stock award of 1,733 shares of Class A Stock based on the closing price of $57.71. All of our non-employee Directors, except for Mr. William J. Pesce, deferred receipt of shares pursuant to the Deferred Compensation Plan, as described above. |
| (3) | The amounts in All Other Compensation include the cash value of dividends accrued under the Deferred Compensation Plan and, in the case of Mr. McDaniel, $10,490.03 in interest credited to his Deferred Cash Compensation Plan in Fiscal 2015 of which, $3,813.39 is forfeitable if Mr. McDaniel resigns his position as a Director before December 31, 2015. Also included are contributions made under the Company’s Matching Gift Program, as described above, as follows: Mr. P Wiley - $82,750, Mr. Pesce- $4,000 and Ms. Baker - $4,000. |
| (4) | Peter Booth Wiley, Chairman of the Board, does not receive a retainer for his service on the board but receives an annual salary as an employee of the Company. Mr. Wiley’s current annual salary is $482,500. |
| (5) | Effective January 1, 2011, Mr. McDaniel deferred receipt of his annual cash retainer in a cash deferral account. |
| (6) | Mr. J. Wiley, Manager, Business Development, Client Solutions and Board Member, does not receive a retainer for his service on the board but receives, as an employee of the Company, an annual base salary of $152,000 and a target annual incentive of $12,600, | (4) | Mr. Jesse Wiley does not receive a retainer for his service on the Board, but in Fiscal 2017 received, as an employee of the Company, an annual base salary of $179,000 and a target annual incentive of $13,366, with payout on the incentive based solely on his role as Manager, Business Development, Client Solutions. |
| (7) | Ms. Katehi resigned from the Board on July 24, 2014.
| (5) | The following Directors requested and received a cash donation from the Company to organizations pursuant the Company’s Matching Gift Program, as described above: Ms. Baker - $15,000, Mr. Bell - $2,000, and Mr. Kissner - $5,000. These amounts are included under “All Other Compensation.” |
| (8) | Mr. Kissner received $8,750 per month in compensation for assuming additional duties related to his possible transition to Chairman of the Board effective October 1, 2015 subject to his re-election to the Board at the 2015 Annual Meeting of Shareholders. During Fiscal 2015 this amount totalled $35,000. | (6) | Mr. Dobson joined the Board in March 2017 and received a prorated cash retainer in the amount of $50,000. Mr. Dobson also received a prorated annual Directors Stock Award of 940Class A Common Stock at $53.20. |
53
| (7) | Mr. Plummer has elected to defer his cash retainer and receives it in share equivalents under the Deferred Compensation Plan for Directors. |
| | | | (8) | Mr. Menascé resigned from the Board effective September 21, 2016. |
| Name | | Number of Shares
Underlying
Outstanding Deferred
Stock Equivalents | | Number of Shares
Underlying
Outstanding
Stock Options | | | Mari J. Baker | | | 10,603 | | | — | | | George Bell | | | 5,954 | | | — | | | David C. Dobson(1) | | | — | | | — | | | Matthew S. Kissner | | | 30,743 | | | — | | | Laurie Leshin | | | 3,753 | | | — | | | Raymond W. McDaniel, Jr. | | | 26,231 | | | — | | | William Pence(1) | | | — | | | — | | | William J. Pesce(1) | | | — | | | — | | | William B. Plummer | | | 44,218 | | | — | | | Kalpana Raina | | | 14,050 | | | — | |
| | (1) Messrs. Dobson, Pence, and Pesce do not defer receipt of their annual stock award. | | | | Number of Shares
Underlying
Outstanding Deferred
Stock Equivalents | | Number of Securities
Underlying
Outstanding
Stock Options | Mari Jean Baker | | | 6,170 | | | | — | | George Bell | | | 1,759 | | | | — | | Linda P. B . Katehi | | | 4,389 | | | | — | | Matthew S. Kissner | | | 22,790 | | | | — | | Raymond W. McDaniel, Jr. | | | 20,995 | | | | — | | Eduardo Menascé | | | 11,530 | | | | — | | William J. Pesce | | | — | | | | — | | William B. Plummer | | | 34,175 | | | | — | | Kalpana Raina | | | 9,440 | | | | — | |
Insurance with Respect to Indemnification of Directors and Officers The By-Laws of the Company provide for indemnification of directors and officers in connection with claims arising from service to the Company to the extent permitted under the New York State Business Corporation Law. The Company carries insurance in the amount of $40,000,000$50,000,000 with Chubb Insurance Company of New Jersey, National Union Fire Insurance Company of Pittsburgh, PA, Allied World National Assurance Company and Federal Insurance Company at a premium of $457,500.$453,500. The current policy expires on November 14, 2015.2017. Transactions with Directors’ Companies
In the ordinary course of business, the Company and its subsidiaries may have transactions with companies and organizations whose executive officers are also Company directors. None of these transactions in fiscal 2015 exceeded the threshold for disclosure under our Corporate Governance Guidelines, which is 2% of the gross revenues of either the Company or the other organization.
OTHER MATTERS Manner and Expenses of Solicitation Since many of our shareholders are unable to attend the Annual Meeting, the Board solicits proxies so that each shareholder has the opportunity to vote on the proposals to be considered at the Annual Meeting. Shareholders of record can vote, and save the Company expense, by using the Internet or by calling the toll-free telephone number printed on the proxy card. Voting instructions (including instructions for both telephonic and Internet voting) are provided on the proxy card. The Internet and telephone voting procedures are designed to authenticate shareholder identities, to allow shareholders to give voting instructions and to confirm that shareholders’ instructions have been recorded properly. Shareholders participating or voting via the Internet should understand that there may be costs associated with electronic access, such as usage charges from Internet access providers and telephone companies, that must be borne by the shareholder. If your shares are held in the name of a bank or broker, follow the voting instructions on the form you receive from such record holder. The availability of Internet and telephone voting will depend on their voting procedures. If you do vote by Internet or telephone, it will not be necessary to return your proxy card. If you do not choose to vote using these two options, you may return your proxy card, properly signed, and the shares will be voted in accordance with your directions. Shareholders are urged to mark the boxes on the proxy card to indicate how their shares are to be voted. If no choices are specified, the shares represented by that proxy card will be voted as recommended by the Board. |
If a shareholder does not return a signed proxy card, vote by the Internet, by telephone or attend the Annual Meeting and vote in person or via the Internet, his or her shares will not be voted. Any shareholder giving a proxy (including one given by the Internet or telephone) has the right to revoke it at any time before it is exercised by giving notice in writing to the Corporate Secretary, of the Company, by delivering a duly executed proxy bearing a later date to the Secretary (or by subsequently completing a telephonic or Internet proxy) prior to the Annual Meeting of Shareholders, or by attending the Annual Meeting and voting in person. Attendance at the Annual Meeting will not in and of itself constitute revocation of a proxy. |
| | The Company will bear the costs of soliciting proxies. In addition to the solicitation of proxies by use of the mail, some of the officers, directors and other employees of the Company may also solicit proxies personally or by mail, telephone or facsimile, but they will not receive additional compensation for such services. Brokerage firms, custodians, banks, trustees, nominees or other fiduciaries holding shares of common stock in their names will be reimbursed for their reasonable out-of-pocket expenses in forwarding proxy material to their principals. | | | | | | Electronic Delivery of Materials | | | | | | The 20152017 Notice of Annual Meeting, Proxy Statement and Annual Report on Form 10-K are available on ourthe website athttps://materials.proxyvote.com/968223. www.proxyvote.com. Instead of receiving future copies of our Proxy Statement and Annual Report materials by mail, shareholders can elect to receive an e-mail that will provide electronic links to them. Selecting this option will save us the cost of producing and mailing documents to your home or business and will also give you an electronic link to the proxy voting site. Shareholders of record and beneficial owners may enroll in the electronic proxy delivery service at any time in the future by going to our enrollment site athttp://enroll.icsdelivery.com/jwa and following the enrollment instructions. | | | | | | Deadline for Submission of Shareholder Proposals | | | | | | If a shareholder intends to present a proposal for action at the 20162018 Annual Meeting and wishes to have such proposal considered for inclusion in our proxy materials in reliance on Rule 14a-8 under the Securities Exchange Act of 1934, the proposal must be submitted in writing and received by the Secretary of the Company by April 19, 2016.20, 2018. Such proposal must also meet the other requirements of the rules of the Securities and Exchange Commission relating to shareholder proposals. | | | | | | If a shareholder submits a proposal outside of Rule 14a-8 for the 2016 Annual Meeting and the proposal fails to comply with the advance notice procedure prescribed by our By-Laws, then the Company’s proxy may confer discretionary authority on the persons being appointed as proxies on behalf of the Company’s Board to vote on the proposal. | | | | | | Our By-Laws establish an advance notice procedure with regard to certain matters, including shareholder proposals and nominations of individuals for election to the Board. In general, written notice of a shareholder proposal or a director nomination for an annual meeting must be received by the Secretary of the Company no later than June 3, 2016,May 31, 2018, and must contain specified information and conform to certain requirements, as set forth in greater detail in the By-Laws. If the Company’s presiding officer at any shareholders’ meeting determines that a shareholder proposal or director nomination was not made in accordance with the By-Laws, the Company may disregard such proposal or nomination. | | | | | | Proposals and nominations should be addressed to Corporate Secretary, John Wiley & Sons, Inc., 111 River Street, Mail Stop 9-01, Hoboken, New Jersey 07030-5774. | | | | | | The Company has not received notice from any shareholder of its intention to bring a matter before the 20142017 Annual Meeting. At the date of this Proxy Statement, the Board of Directors does not know of any other matter to come before the meeting other than the matters set forth in the Notice of Meeting. However, if any other matter, not now known, properly comes before the meeting, the persons named on the enclosed proxy will vote said proxy in accordance with their best judgment on such matter. Shares represented by any proxy will be voted with respect to the proposals outlined above in accordance with the choices specified therein or in favor of any proposal as to which no choice is specified. |
The Company will provide, without charge, a copy of its Annual Report on Form 10-K filed with the Securities and Exchange CommissionSEC for fiscal year 2015,Fiscal 2017, including the financial statements and the schedules thereto. All such requests should be directed to Corporate Secretary, John Wiley & Sons, Inc., 111 River Street, Mail Stop 9-01, Hoboken, New Jersey 07030-5774. | | | | | | It is important that your proxy be returned promptly, whether by mail, by the Internet or by telephone. You may revoke the proxy at any time before it is exercised. If you attend the meeting in person, you may withdraw any proxy (including an Internet or telephonic proxy) and vote your own shares. | By Order of the Board of Directors |
| | | BY ORDER OF THE BOARD OF DIRECTORS | | | | | | | | | JOANNA JIA | | | | Corporate Secretary | | | | | | | Hoboken, New Jersey | | | | August 18, 2017 | |

| | Edward J. May | | Corporate Secretary |
Hoboken, New Jersey
August 17, 2015

JOHN WILEY & SONS, INC.
111 RIVER STREET
HOBOKEN, NJ 07030 | VOTE BY INTERNET Before The Meeting- Go towww.proxyvote.com [THIS PAGE INTENTIONALLY LEFT BLANK]Use the Internet to transmit your voting instructions and for electronic delivery of information up until 11:59 P.M. Eastern Time on September 27, 2017 or the cut-off date for the 401K Plan participants noted below. Have your proxy card in hand when you access the web site and follow the instructions to obtain your records and to create an electronic voting instruction form.
During The Meeting- Go towww.virtualshareholdermeeting.com/JWA2017 You may attend the Meeting via the Internet and vote during the Meeting. Have the information that is printed in the box marked by the arrow available on your proxy card and follow the instructions. VOTE BY PHONE - 1-800-690-6903 Use any touch-tone telephone to transmit your voting instructions up until 11:59 P.M. Eastern Time on September 27, 2017 or the cut-off date for the 401K Plan participants noted below. Have your proxy card in hand when you call and then follow the instructions. VOTE BY MAIL Mark, sign and date your proxy card and return it in the postage-paid envelope we have provided or return it to Vote Processing, c/o Broadridge, 51 Mercedes Way, Edgewood, NY 11717. Admission Ticket - Not Transferable |
| | TO VOTE, MARK BLOCKS BELOW IN BLUE OR BLACK INK AS FOLLOWS: |
| E32268-Z70866 | KEEP THIS PORTION FOR YOUR RECORDS | | DETACH AND RETURN THIS PORTION ONLY | 
| |
| | | | | | | | | | | | | | | | | | JOHN WILEY & SONS, INC. | For
All | Withhold
All | For All Except | | To withhold authority to vote for any individual nominee(s), mark “For All Except” and write the number(s) of the nominee(s) on the line below. | | | | | | The Board of Directors recommends a vote “FOR” all nominees, “FOR” proposals 2 and 3, and “Every Year” for proposal 4. | | | | | | | | | | Vote on Directors: | ☐ | ☐ | ☐ | | | | | | | | | | | | | | | | | | | | | | | | | 1. | The election as directors of all nominees listed below, except as marked to the contrary. | | | | | | | | | | | | | | | | | | | | | | | | Nominees: | | | | | | | | | | | | | | | | | | | | | | | | 01) | George Bell | 03) | William Pence | | | | | | | | | | | | | 02) | Laurie A. Leshin | 04) | Kalpana Raina | | | | | | | | | | | | | | | | | | | | | | | | | | | | | | | | | | | | | | | | | | | | | | Vote on Proposals: | For | Against | Abstain | | | | | | | | | | | | | | | | | | 2. | Ratification of the appointment of KPMG LLP as independent accountants for the fiscal year ending April 30, 2018. | ☐ | ☐ | ☐ | | Notice to participants in the John Wiley & Sons, Inc. Employee Savings Plan (“401K”) and the Payroll Deduction Employee Stock Purchase Plan (“ESPP”): If you participate in the 401K or the ESPP, this proxy card includes shares that the relevant plans have credited to this account. To allow for sufficient time for the 401K Trustee to vote, the Trustee must receive your voting instructions by 11:59 p.m. Eastern Daylight Time on Monday, September 25th, 2017. If the 401K Trustee does not receive your instructions by that date, the Trustee will vote the shares held in the same proportion as votes from other participants in the 401K. PLEASE SIGN EXACTLY AS YOUR NAME(S) APPEAR(S) ON THIS CARD. When signing as an attorney, executor, administrator, trustee or guardian, please give your full title. If shares are held jointly, each holder should sign. Please sign exactly as your name(s) appear(s) hereon. | | | | | | | | | | | | | | | | | | | | 3. | Approval, on an advisory basis, of the compensation of the named executive officers. | ☐ | ☐ | ☐ | | | | | | | | | | | | Every Year | Every Two Years | Every Three Years | Abstain | | | | | | | | | | | | | | | | | | | | | 4. | Approval, on an advisory basis, of the frequency of the named executive officer compensation vote. | ☐ | ☐ | ☐ | ☐ | | | | | | | | | | | | | | | | | | | | | For address changes and/or comments, please check this box and write them on the back where indicated. | | | ☐ | | | | | | | | | | | | | | | | Please indicate if you plan to attend this meeting. | ☐ | ☐ | | | | | | | | | | | | | | | | | | | Yes | No | | | | | | | | | | | | | | | | | | | | | | | | PLEASE COMPLETE, DATE, SIGN, AND MAIL THIS INSTRUCTION CARD PROMPTLY IN THE ENCLOSED POSTAGE-PAID ENVELOPE OR PROVIDE YOUR INSTRUCTIONS TO VOTE VIA THE INTERNET OR BY TELEPHONE. | | | | | | | | | | | | | | | | | | | | | | | | | | | | | | | | | | | | | | | | Signature [PLEASE SIGN WITHIN BOX] | Date | | | | | Signature (Joint Owners) | | Date | | |
V.1.1 JOHN WILEY & SONS, INC. - ANNUAL MEETING, SEPTEMBER 28, 2017 ADMISSION TICKET 2017 Annual Meeting of Stockholders
September 28, 2017 at 8:00 A.M. You should present this admission ticket in order to gain admittance to the meeting. This ticket admits only the stockholder(s) listed on the reverse side and is not transferable. Each stockholder may be asked to present valid picture identification, such as a driver’s license. Cameras, recording devices and other electronic devices will not be permitted at the meeting. YOUR VOTE IS IMPORTANT! PLEASE SEE REVERSE SIDE FOR VOTING INSTRUCTIONS | | CLASS A | | | | |
Important Notice Regarding the Availability of Proxy Materials for the Annual Meeting: The Notice & Proxy Statement and Annual Report on Form 10-K are available at www.proxyvote.com. 
E32269-Z70866 PROXY/VOTING INSTRUCTION CARD JOHN WILEY & SONS, INC. THIS PROXY IS SOLICITED ON BEHALF OF THE BOARD OF DIRECTORS The undersigned hereby appoints Matthew S. Kissner and Gary M. Rinck as the proxies of the undersigned, with full power of substitution to each of them, to vote the Class A Common Stock, which the signee is entitled to vote at the Annual Meeting of Shareholders of John Wiley & Sons, Inc. and any and all adjournments thereof, to be held online at www.virtualshareholdermeeting.com/JWA2017, and at the Company’s headquarters, 111 River Street, Hoboken, New Jersey 07030, on September 28, 2017, at 8:00 A.M., Eastern Daylight Saving Time. The proxies are directed to vote as specified, and in their discretion on all other matters which may come before the meeting or any adjournments thereof. If no direction is given, this proxy will be voted “FOR” the Election of Directors, “FOR” Proposals 2 and 3, and “Every Year” for Proposal 4. | | | | | Address Changes/Comments: | | | | | | | | | | | | | | | | | | |
(If you noted any Address Changes/Comments above, please mark corresponding box on the reverse side.) (Continued, and to be marked, dated and signed, on the other side) V.1.1
JOHN WILEY & SONS, INC.
111 RIVER STREET
HOBOKEN, NJ 07030 | 
VOTE BY INTERNET Before The Meeting- Go towww.proxyvote.com Use the Internet to transmit your voting instructions and for electronic delivery of information up until 11:59 P.M. Eastern Time on September 27, 2017. Have your proxy card in hand when you access the web site and follow the instructions to obtain your records and to create an electronic voting instruction form. During The Meeting- Go towww.virtualshareholdermeeting.com/JWA2017 You may attend the Meeting via the Internet and vote during the Meeting. Have the information that is printed in the box marked by the arrow available on your proxy card and follow the instructions. VOTE BY PHONE - 1-800-690-6903 Use any touch-tone telephone to transmit your voting instructions up until 11:59 P.M. Eastern Time on September 27, 2017. Have your proxy card in hand when you call and then follow the instructions. VOTE BY MAIL Mark, sign and date your proxy card and return it in the postage-paid envelope we have provided or return it to Vote Processing, c/o Broadridge, 51 Mercedes Way, Edgewood, NY 11717. Admission Ticket - Not Transferable |
| | | TO VOTE, MARK BLOCKS BELOW IN BLUE OR BLACK INK AS FOLLOWS: | | E32270-Z70866 | KEEP THIS PORTION FOR YOUR RECORDS | | | DETACH AND RETURN THIS PORTION ONLY | THIS PROXY/VOTING INSTRUCTION CARD IS VALID ONLY WHEN SIGNED AND DATED. |
| JOHN WILEY & SONS, INC. | For
All | Withhold
All | For All Except | | To withhold authority to vote for any individual nominee(s), mark “For All Except” and write the number(s) of the nominee(s) on the line below. | | | | | | | | | | | | The Board of Directors recommends a vote “FOR” all nominees, “FOR” proposals 2 and 3, and “Every Year” for proposal 4. | | | | | | | | | | | | | | | | | Vote on Directors: | ☐ | ☐ | ☐ | | | | | | | | | | | | | | | | | | | | | | | | 1. | The election as directors of all nominees listed below, except as marked to the contrary. | | | | | | | | | | | | | | | | | | | | | | | | Nominees: | | | | | | | | | | | | | | | | | | | | | | | | 01) | Matthew S. Kissner | 05) | David C. Dobson | | | | | | | | | | | | | 02) | Mari J. Baker | 06) | Jesse C. Wiley | | | | | | | | | | | | | 03) | William J. Pesce | 07) | Raymond W. McDaniel, Jr. | | | | | | | | | | | | | 04) | William B. Plummer | | | | | | | | | | | | | | | | | | | | Every | Every | | | | | | | | | | Every | Two | Three | | | | Vote on Proposals: | For | Against | Abstain | | | Year | Years | Years | Abstain | | | | | | | | | | | | | | | | 2. | Ratification of the appointment of KPMG LLP as independent accountants for the fiscal year ending April 30, 2018. | ☐ | ☐ | ☐ | | 4. Approval, on an advisory basis, of the frequency of the named executive officer compensation vote. | ☐ | ☐ | ☐ | ☐ | | | | | | | | | | | | | | | 3. | Approval, on an advisory basis, of the compensation of the named executive officers. | ☐ | ☐ | ☐ | | | | | | | | | | | | | | | | | | | PLEASE COMPLETE, DATE, SIGN, AND MAIL THIS INSTRUCTION CARD PROMPTLY IN THE
ENCLOSED POSTAGE-PAID ENVELOPE OR PROVIDE YOUR INSTRUCTIONS TO VOTE VIA THE
INTERNET OR BY TELEPHONE. | | | | | | | | | | | | | | | | | | | | | | | | | | | For address changes and/or comments, please check this box and write them on the back where indicated. | | | ☐ | | | | | | | | | | | | | | | | | | Please indicate if you plan to attend this meeting. | ☐ | ☐ | | | | | | | | | | | | | | | | | | | | Yes | No | | | | | | | | | | | | | | | | | | | PLEASE SIGN EXACTLY AS YOUR NAME(S) APPEAR(S) ON THIS CARD. When signing as an attorney, executor, administrator, trustee or guardian, please give your full title. If shares are held jointly, each holder should sign. Please sign exactly as your name(s) appear(s) hereon. | | | | | | | | | | | | | |
| | | | | | | | | | | | | | | | | | | | | | | | | Signature [PLEASE SIGN WITHIN BOX] | Date | | | Signature (Joint Owners) | | | | Date | | |
V.1.1 JOHN WILEY & SONS, INC. - ANNUAL MEETING, SEPTEMBER 28, 2017 ADMISSION TICKET 2017 Annual Meeting of Stockholders
September 28, 2017 at 8:00 A.M. You should present this admission ticket in order to gain admittance to the meeting. This ticket admits only the stockholder(s) listed on the reverse side and is not transferable. Each stockholder may be asked to present valid picture identification, such as a driver’s license. Cameras, recording devices and other electronic devices will not be permitted at the meeting. YOUR VOTE IS IMPORTANT! PLEASE SEE REVERSE SIDE FOR VOTING INSTRUCTIONS Important Notice Regarding the Availability of Proxy Materials for the Annual Meeting: The Notice & Proxy Statement and Annual Report on Form 10-K are available at www.proxyvote.com. E32271-Z70866 PROXY/VOTING INSTRUCTION CARD JOHN WILEY & SONS, INC. THIS PROXY IS SOLICITED ON BEHALF OF THE BOARD OF DIRECTORS The undersigned hereby appoints Matthew S. Kissner and Gary M. Rinck as the proxies of the undersigned, with full power of substitution to each of them, to vote the Class B Common Stock, which the signee is entitled to vote at the Annual Meeting of Shareholders of John Wiley & Sons, Inc. and any and all adjournments thereof, to be held online at www.virtualshareholdermeeting.com/JWA2017, and at the Company’s headquarters, 111 River Street, Hoboken, New Jersey 07030, on September 28, 2017, at 8:00 A.M., Eastern Daylight Saving Time. The proxies are directed to vote as specified, and in their discretion on all other matters which may come before the meeting or any adjournments thereof. If no direction is given, this proxy will be voted “FOR” the Election of Directors, “FOR” Proposals 2 and 3, and “Every Year” for Proposal 4. | | | | | Address Changes/Comments: | | | | | | | | | | | | | | | | | | |
(If you noted any Address Changes/Comments above, please mark corresponding box on the reverse side.) (Continued, and to be marked, dated and signed, on the other side) V.1.1 
|
|
|
|
|
|
|
|
|
|
|
|
|
|
|
|
|
|
|
|
|
|
|
|
|
|
|
|
|
|
|
|
|
|